Developers tend to treat tracing as deep magic, and OpenTelemetry is no exception. OpenTelemetry may be even
more mysterious given how many concepts your are exposed to even with
beginning examples.
[1]
It also doesn’t help that as part of building a mature, battle-tested tracing library, the code itself tends to become more and more cryptic over time, contorting itself to avoid edge-cases, work across many environments, and optimize code paths to avoid impacting performance of its host applications. Auto-instrumentation is particularly prone to inscrutibility as it seeks to auto-magically wrap code that may never have been intended to be wrapped or extended.
It’s no wonder then that most developers approach tracing libraries as unknowable black boxes. We add them to our applications, cross our fingers, and hope they give us useful information when the pager goes off at 2am.
They are likely a lot simpler than you expect! Once you peel back the layers, I find a useful mental model of tracing looks like “fancy logging” combined with “context propagation” a.k.a “passing some IDs around”.
Logs
Developers tend to be very comfortable with logs. We start off with “Hello world!”, and they stay with us forever after.
We reach for them to add console.log("potato") to see if our code is even being run (even though the debugger is
like right there).
Logs are useful! Though hopefully someone comes along and convinces you that your logs should always be structured as sets of key / value pairs.
If you make one New Year’s resolution related to modernizing your infrastructure and preparing for the brave new world of distributed systems, I suggest this:
— Charity Majors (@mipsytipsy) January 11, 2018
Structure your logs.
You won’t be sorry. You will eventually be so, so glad you did.
Just do it.
It’s nice to have some consistency in your logs: make sure each one has a consistently-formatted timestamp or includes a field like “name” so you can easily find them when searching. You probably have found yourself writing a helper function like this in your projects:
log("user-authenticated", { userId, remaingingRateLimit });

// ...

function log(name, attributes = {}) {
  console.log(
    JSON.format({
      name,
      timestamp: new Date().getTime(),
      ...attributes,
    })
  );
}
{ "timestamp": 1725845013447, "name": "user-authenticated", "userId": "1234", "remaingingRateLimit": 100 }You might also have written something to help track how long some sub-task takes:
logTiming("query-user-info", () => {
  db.fetchUserInfo();
});

// ....

function logTiming(name, attributes = {}, lambda) {
  let startTime = new Date().getTime();

  // run some subtask
  lambda();

  let durationMs = new Date().getTime() - startTime;
  log(name, { durationMs, ...attributes });
}
{ "timestamp": 1725845013447, "name": "query-user-info", "durationMs": 12 }If so, congrats! You’re halfway to re-inventing trace spans.
Spans are ✨fancy✨ log lines
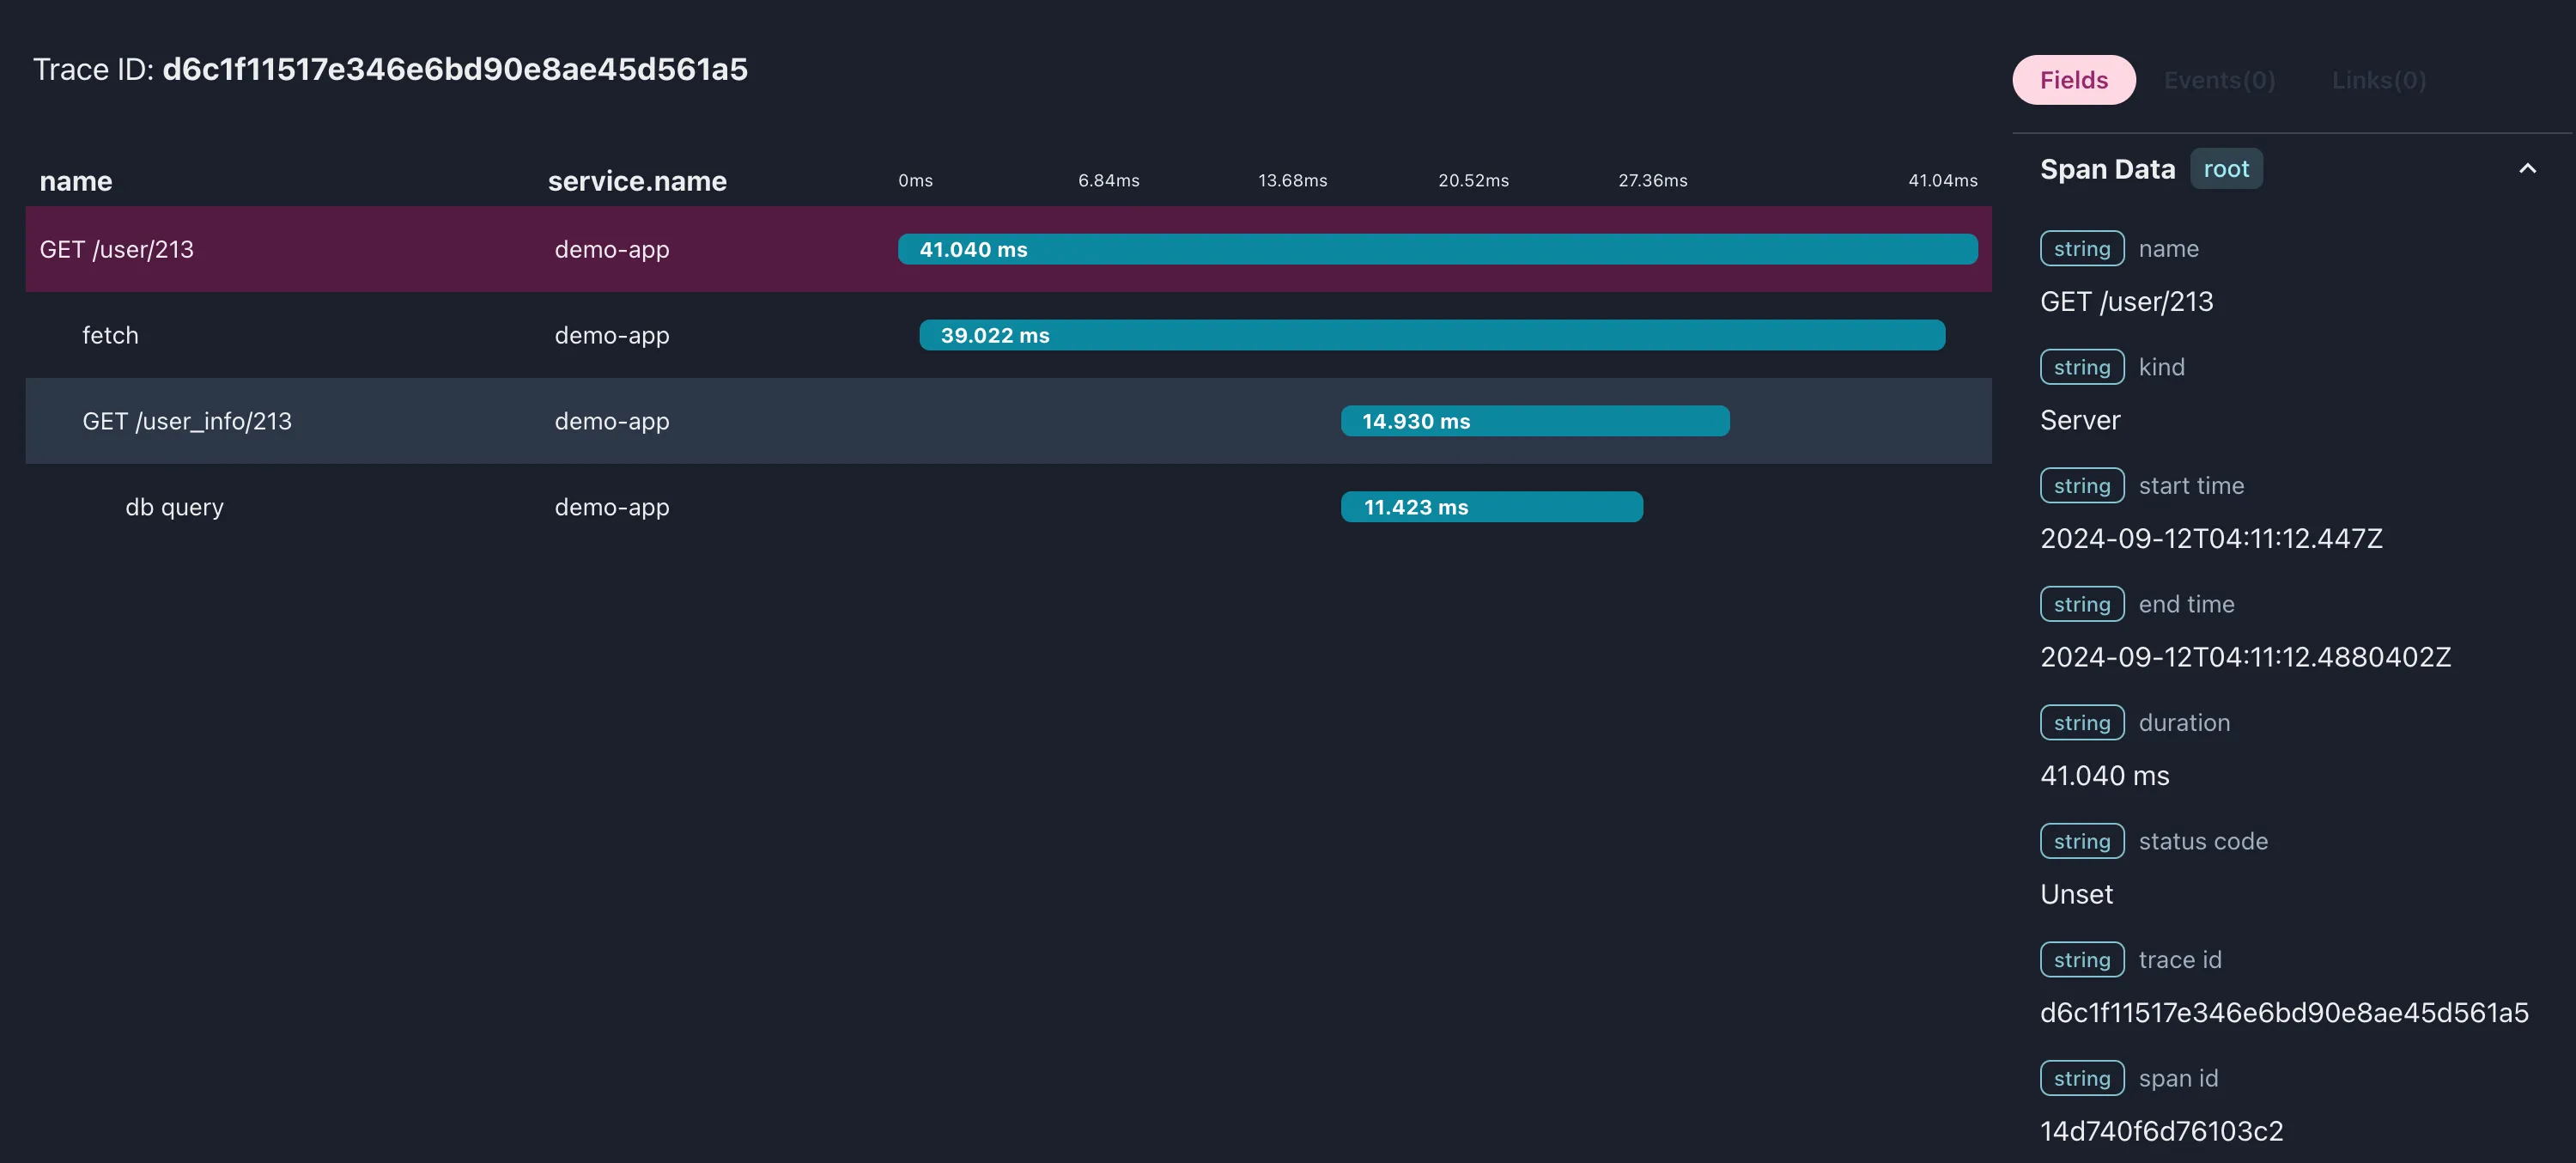
A trace is built-up of spans. The example below shows a single trace with 4 different spans:
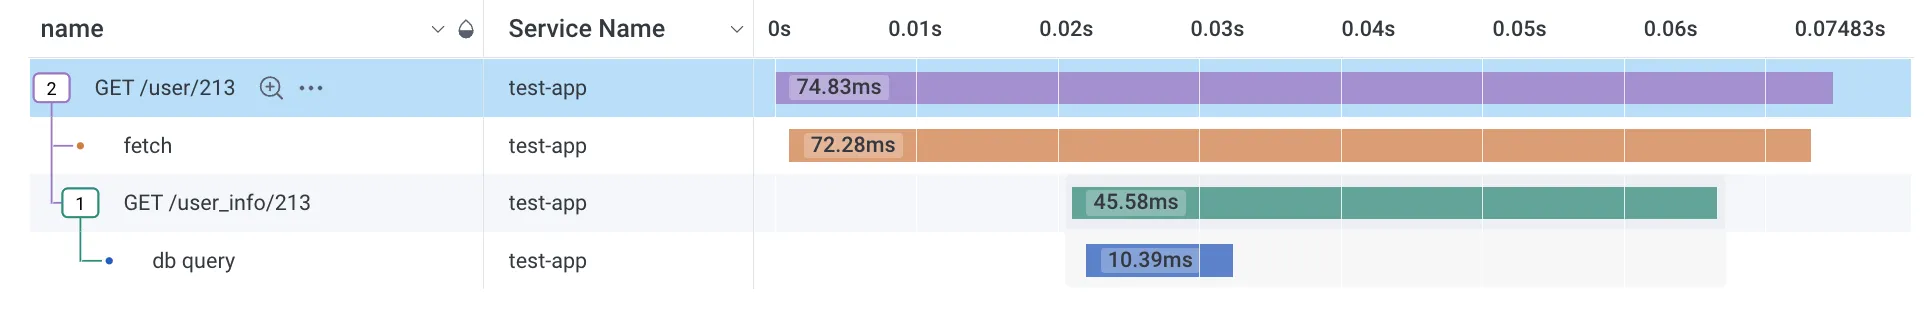
You can think of a span as a collection of key / value pairs, much like a log line, with a few required fields. Spans must have:
- a name
- a timestamp
- a duration
- a set of IDs: trace ID, span ID, and a parent span ID. More about these later
All other fields can be added as additional keys and values in an attributes map.
In code this might look something like this:
let span = new Span("api-req");
let resp = await api("get-user-limits");
span.setAttributes({ responseCode: resp.code });
span.End();
console.log(span);

// ...

class Span {
  constructor(name, context = {}, attributes = new Map()) {
    this.startTime = new Date().getTime();
    this.traceID = context.traceID ?? crypto.randomBytes(16).toString("hex");
    this.parentSpanID = context.spanID ?? undefined;
    this.spanID = crypto.randomBytes(8).toString("hex");
    this.name = name;
    this.attributes = attributes;
  }

  setAttributes(keyValues) {
    for (let [key, value] of Object.entries(keyValues)) {
      this.attributes.set(key, value);
    }
  }

  end() {
    this.durationMs = new Date().getTime() - this.startTime;
  }
}
This output would be:
Span {
  startTime: 1722436476271,
  traceID: 'cfd3fd1ad40f008fea72e06901ff722b',
  parentSpanID: undefined,
  spanID: '6b65f0c5db08556d',
  name: 'api-req',
  attributes: Map(0) {
    "responseCode": 200
  },
  durationMs: 3903
}
which we could format as an equivalent log line:
{
  "startTime": 1722436476271,
  "traceID": "cfd3fd1ad40f008fea72e06901ff722b",
  "spanID": "6b65f0c5db08556d",
  "name": "api-req",
  "responseCode": 200,
  "durationMs": 3903
}
Traces are collections of spans
If you want to see all of the logs from a particular request, you have likely done something like:
// generate a request id and inherit one from your platform
let requestID = req.headers["X-REQUEST-ID"];
// ...
log("api-request-start", { requestID });
let resp = await apiRequest();
log("api-request-end", { requestID });
which would allow you to search for a particular request id to see what happened while that particular request was executed:
{ "timestamp": 1722436476271, "requestID": "1234", "name": "fetch-user-permissions" }
{ "timestamp": 1722436476321, "requestID": "1234", "name": "api-request-start" }
{ "timestamp": 1722436476345, "requestID": "1234", "name": "api-request-end" }
{ "timestamp": 1722436476431, "requestID": "1234", "name": "update-db-record" }
{ "timestamp": 1722436476462, "requestID": "1234", "name": "create-email-job" }
Tracing execution like this can get you surprisingly far! But we can do better.
Trace spans have 3 different IDs that make up the Trace Context. The first two are really simple:
- Span ID: a random ID for each span
- Trace ID: a random ID that multiple spans can share
The last one is a little more complicated:
- Parent Span ID: the Span ID that was the active span when this span was created
The Parent Span ID is what allows a system to create a DAG out of each trace once it has received each individual span. When rendered as a tree this results in the waterfall view we all know and love, but it’s important to remember that this is only one possible visualization of the data.
Existing in the context
Our context only really needs two values: the trace id, and the id of the current span. When
we create a new span, we can inherit the spanID if one exists, generate a new spanID,
and set the new context.
let context = {
  traceID: "cfd3fd1ad40f008fea72e06901ff722b",
  spanID: "6b65f0c5db08556d",
};
We need some way of passing this context around our application. We could do this manually:
let { span, newContext } = new Span("api-req", oldContext);Indeed, this is how it is done in the official Go SDK however in most languages this is done implicitly and handled automatically by the library. In Ruby or Python you can use a thread local variable, but in Node you would use AsyncLocalStorage.
At this point it helps to wrap our span creation in a helper function:
import { AsyncLocalStorage } from "node:async_hooks";

let asyncLocalStorage = new AsyncLocalStorage();
// start with an empty context
asyncLocalStorage.enterWith({ traceID: undefined, spanID: undefined });

async function startSpan(name, lambda) {
  let ctx = asyncLocalStorage.getStore();
  let span = new Span(name, ctx, new Map());
  await asyncLocalStorage.run(span.getContext(), lambda, span);
  span.end();
  console.log(span);
}

startSpan("parent", async (parentSpan) => {
  parentSpan.setAttributes({ outerSpan: true });
  startSpan("child", async (childSpan) => {
    childSpan.setAttributes({ outerSpan: false });
  });
});
And with that we have the core of our tracing library done! 🎉
Span {
  startTime: 1725850276756,
  traceID: 'b8d002c2f6ae1291e0bd29c9791c9756',
  parentSpanID: '50f527cbf40230c3',
  name: 'child',
  attributes: Map(1) { 'outerSpan' => false },
  spanID: '8037a93b6ed25c3a',
  durationMs: 11.087375000000002
}
Span {
  startTime: 1725850276744,
  traceID: 'b8d002c2f6ae1291e0bd29c9791c9756',
  parentSpanID: undefined,
  name: 'parent',
  attributes: Map(1) { 'outerSpan' => true },
  spanID: '50f527cbf40230c3',
  durationMs: 26.076625
}
Our tracing library is perfectly usable even at under 60 LoC but it has 2 big drawbacks:
- We have to manually add it everywhere
- It also is restricted to a single system. We do not have a mechanism for passing the trace context between any two systems in our larger service.
Let’s fix that!
Going distributed
Distributed tracing sounds scary and intimidating, but it generally means that tracing context can be passed around between systems so that you can track what operation kicked off what other operation, and that all of this data gets reported to the same place at the end.
Whenever we make an HTTP call to another system, we need to pass along the Trace ID and the
Current Span ID. We could add these two fields to all of our HTTP payloads manually but
there’s a W3C standard for how to encode this into
an HTTP header so that it gets sent as metadata for every request. The traceparent header
looks like:
00-0af7651916cd43dd8448eb211c80319c-b7ad6b7169203331-01There is a full specification to digest and implement here, but for our purposes today we can ignore most of this and think of it as conforming to this format:
00-{ Trace ID}-{ Parent Span ID }-01which allows us to parse and serialize our trace context with some simple functions:
let getTraceParent = (ctx) => `00-${ctx.traceID}-${ctx.spanID}-01`;

let parseTraceParent = (header) => ({
  traceID: header.split("-")[1],
  spanID: header.split("-")[2],
});
We need to be sure to add it to our outgoing requests, and parse it on any incoming requests. Instrumentation helps with that.
Wrap stuff in other stuff
Instrumentation is a fancy term for “wrap some other code in our code so we can track stuff”. Real tracing libraries sometimes go to extreme lengths to make wrapping built-in or popular libraries happen behind the scenes when you configure the library. We’re not going to be doing that.
Instead we’ll provide some middleware for the Hono web framework that the user can manually add.
async function honoMiddleware(c, next) {
  // check the incoming request for the traceparent header
  // if it exists parse and inherit the trace context
  let context = EMPTY_CONTEXT;
  if (c.req.header("traceparent")) {
    context = parseTraceParent(c.req.header("traceparent"));
  }

  // set the context and wrap the whole req / res operation in a span
  await setContext(context, async () => {
    await startSpan(`${c.req.method} ${c.req.path}`, async (span) => {
      // Before we let our app handle the request, let's pull some info about
      // it off and add it to our trace.
      span.setAttributes({
        "http.request.method": c.req.method,
        "http.request.path": c.req.path,
      });

      // let our app handle the request
      await next();

      // Pull information about how our app responded
      span.setAttributes({
        "http.response.status_code": c.res.status,
      });
    });
  });
}
We also need to handle making outgoing HTTP calls and making sure we attach the traceparent
header. There is no built-in concept of middleware for the built-in fetch command, so instead
we’re going to wrap it like a javascript burrito. We’ll have to do this ourselves, but it’s not
so bad, especially compared to what doing it for real looks like.
// pass the original function into our wrapping logic
function patchFetch(originalFetch) {
  // return a function with the same signature, but that executes our logic too
  return async function patchedFetch(resource, options = {}) {
    // generate and add the traceparent header
    let ctx = getContext();

    if (!options.headers) {
      options.headers = {};
    }
    options.headers["traceparent"] = getTraceParent(ctx);

    // run the underlying fetch function, but wrap it in a span and
    // pull out some info while we're at it
    let resp;
    await startSpan("fetch", async (span) => {
      span.setAttributes({ "http.url": resource });
      resp = await originalFetch(resource, options);
      span.setAttributes({ "http.response.status_code": resp.status });
    });

    // pass along fetch's response. It's like we were never here
    return resp;
  };
}
Here’s a quick little app to show off our tracer in action.
Let’s send this to Honeycomb
We can log out our spans to the terminal, but that’s not a great user experience. Before we look at OpenTelemetry, I think it’s instructive to look at Honeycomb’s Event’s API. Before Honeycomb went all-in on OpenTelemetry they had a much simpler just-send-us-JSON approach. They no longer recommend it, but we can still use this API today for our toy project.
You can see the full exporter code here, but the logic for building the payload is the interesting bit:
// literally put all of the data together in one big json blob... like a log line!
// and then POST it to their API
function spanToHoneycombJSON(span) {
return {
...Object.fromEntries(globalAttributes),
...Object.fromEntries(span.attributes),
name: span.name,
trace_id: span.traceID,
span_id: span.spanID,
parent_span_id: span.parentSpanID,
start_time: span.startTime,
duration_ms: span.durationMs,
};
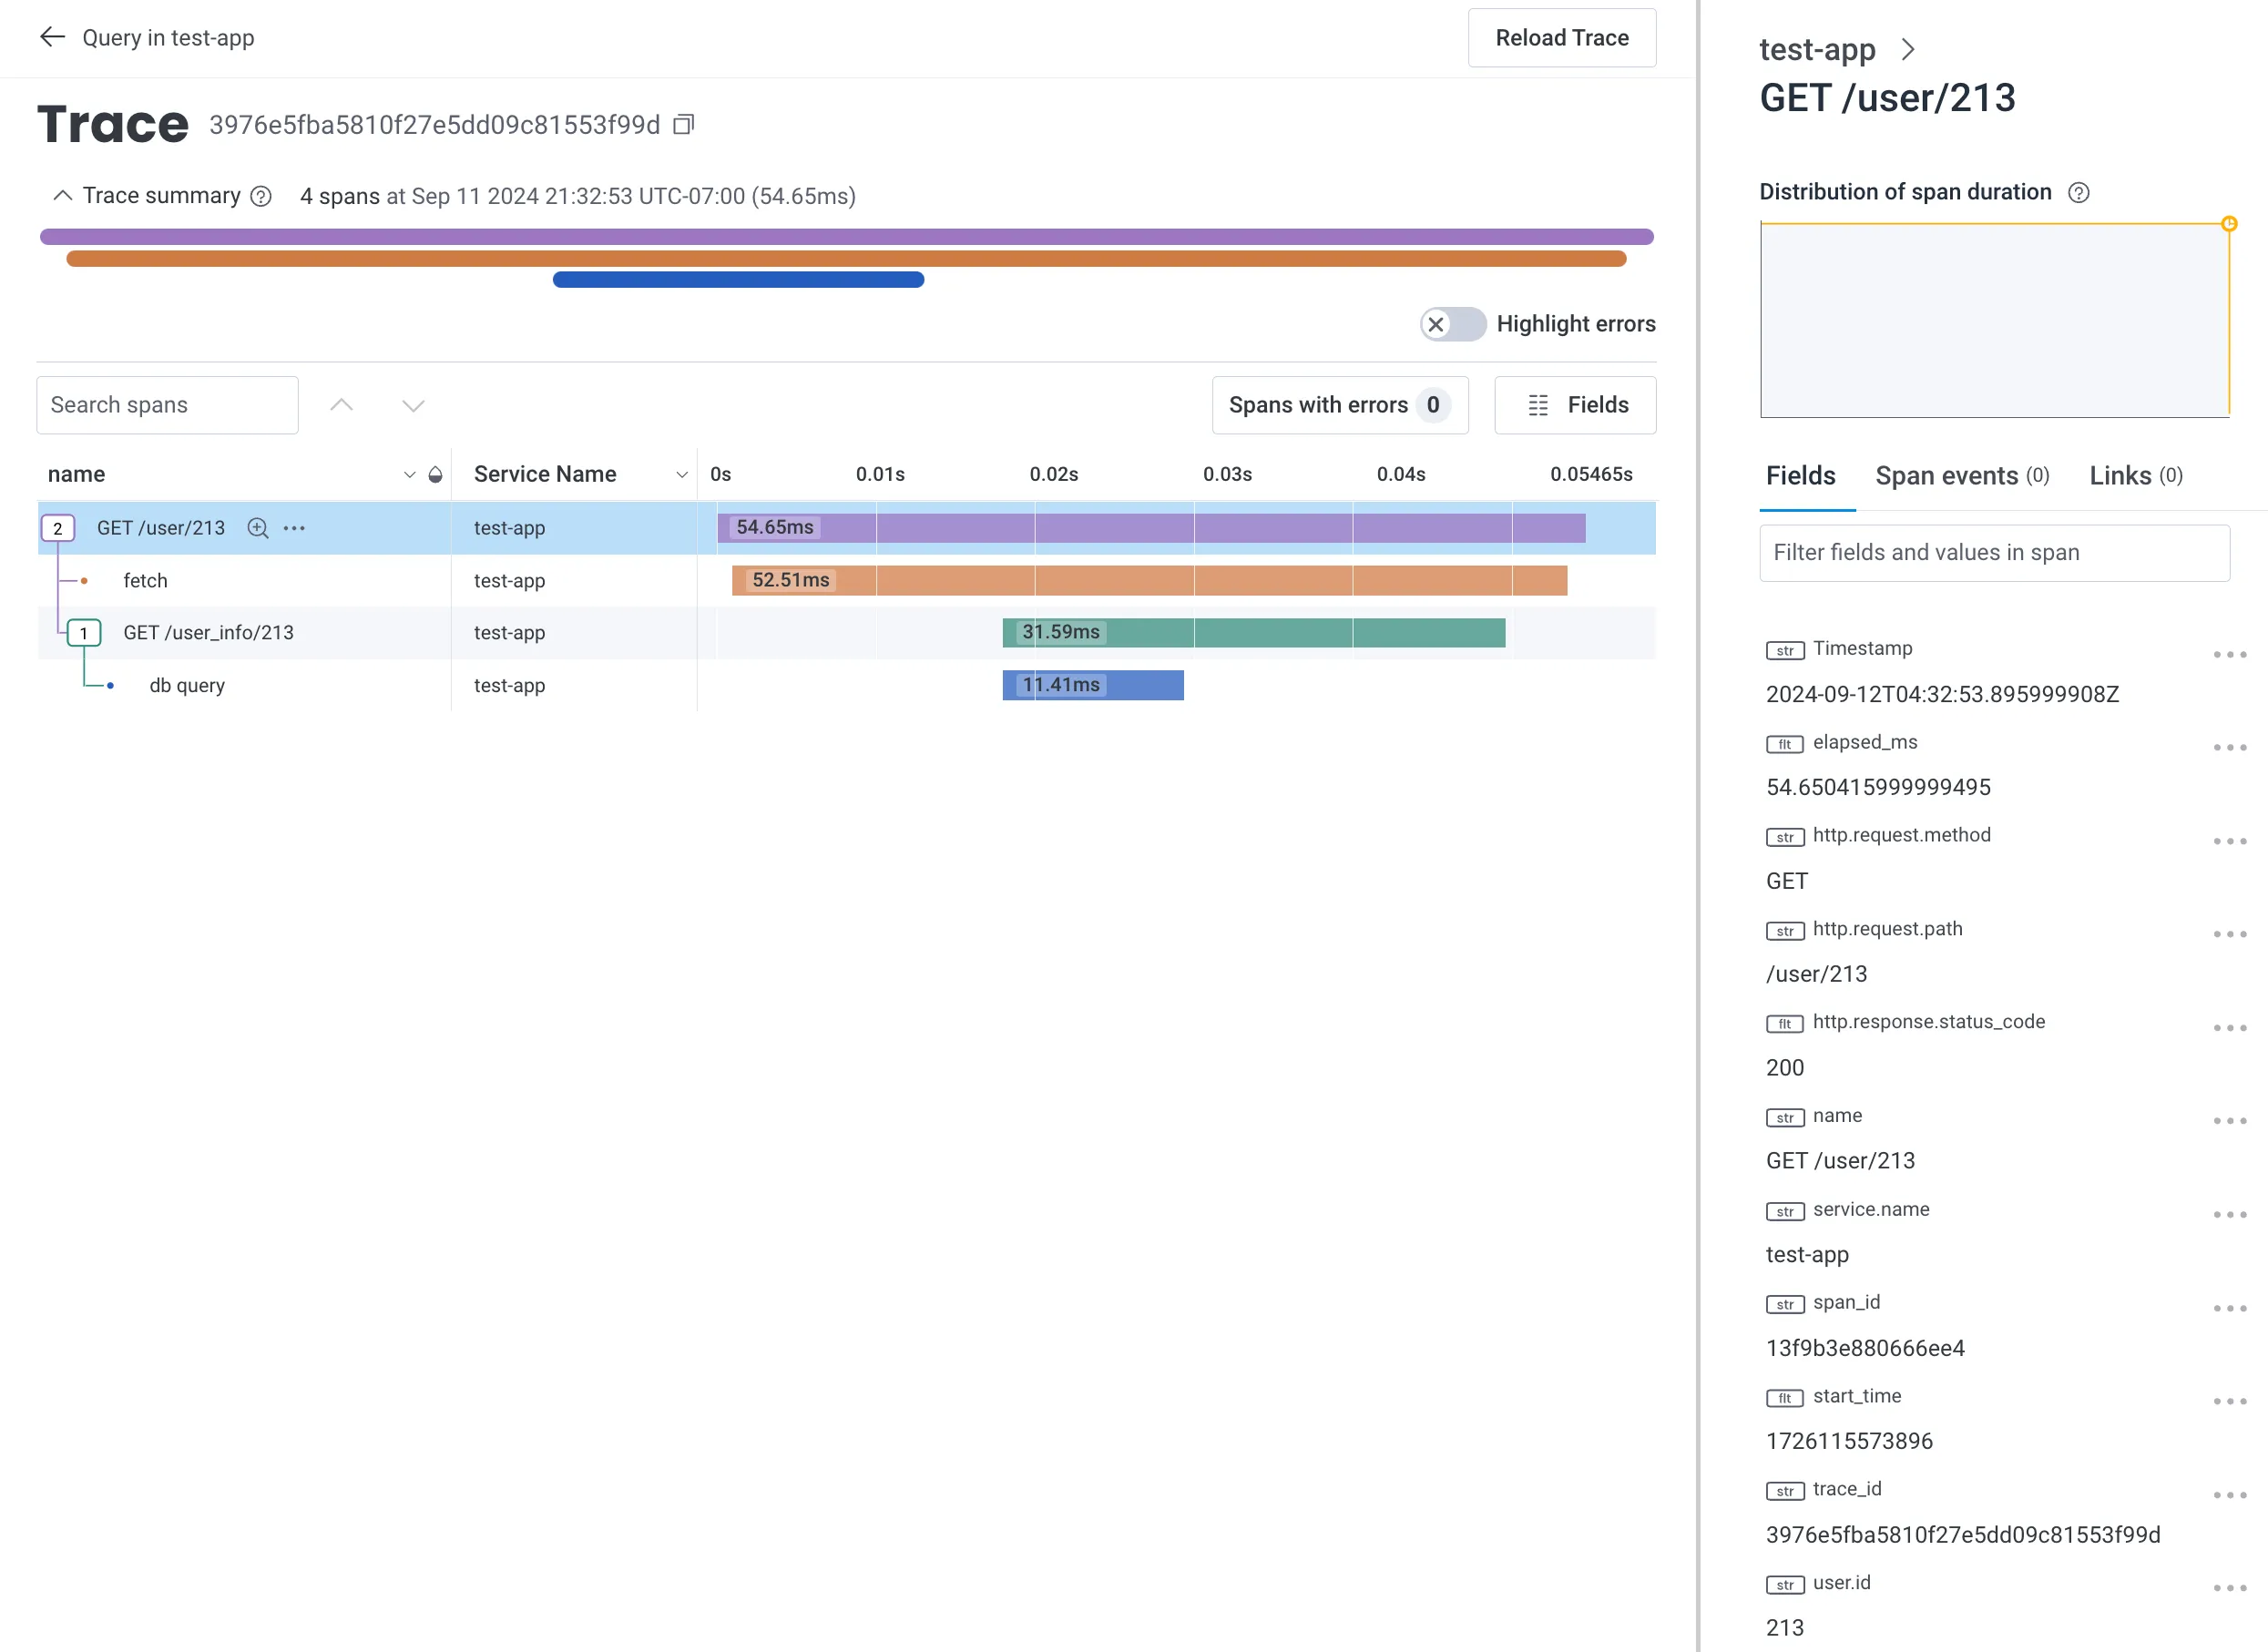
}Since we’re not using a standard format you do have to tell Honeycomb which field maps to Trace ID, Span ID, etc in the dataset configuration, but this is all the data needed to build up the trace waterfall!
Where’s the OpenTelemetry?
So we have our fancy logs tracing set up, and instrumentation and context propagation
are actually pretty simple, but OpenTelemetry is a big, complicated standard! Have you
read through the specification!?
And… that’s not wrong. OpenTelemetry is a big project, however we only need one small part of it for our purposes. When you install an OpenTelemetry SDK for your langauge it emits data in the OpenTelemetry Protocol (OTLP). Every OpenTelemetry SDK in every language emits OTLP. The OpenTelemetry Collector is a collection of tools for receiving OTLP, transforming OTLP, translating other formats to OTLP. You could say OTLP is kind of a big deal.
OTLP has its own protobuf specification
so you can efficiently compress telemetry data into a binary message that will be the same
across any platform, OS, or CPU architecture. We could generate a JavaScript module to
parse and emit these protobuf messages from the .proto files, but that sounds like
too much work.
Protobuf also defines a JSON mapping as part of the spec, and the specification repo has a handy example for us to start from, so let’s keep it simple instead.
Generating this payload is a bit more complicated than Honeycomb’s old events format. There are some new terms like “resource” and “scope”, and we have to massage the attributes a bit. However if you squint, you can see that it’s all the same data. Full version here
function spanToOTLP(span) {
  return {
    resourceSpans: [
      {
        resource: {
          attributes: toAttributes(Object.fromEntries(globalAttributes)),
        },
        scopeSpans: [
          {
            scope: {
              name: "minimal-tracer",
              version: "0.0.1",
              attributes: [],
            },
            spans: [
              {
                traceId: span.traceID,
                spanId: span.spanID,
                parentSpanId: span.parentSpanID,
                name: span.name,
                startTimeUnixNano: span.startTime * Math.pow(10, 6),
                endTimeUnixNano:
                  (span.startTime + span.elapsedMs) * Math.pow(10, 6),
                kind: 2,
                attributes: toAttributes(Object.fromEntries(span.attributes)),
              },
            ],
          },
        ],
      },
    ],
  };
}
However the power of standards means that we’re no longer limited to just one vendor. We can now send this to any service that accepts OpenTelemetry!
Honeycomb still works, of course.
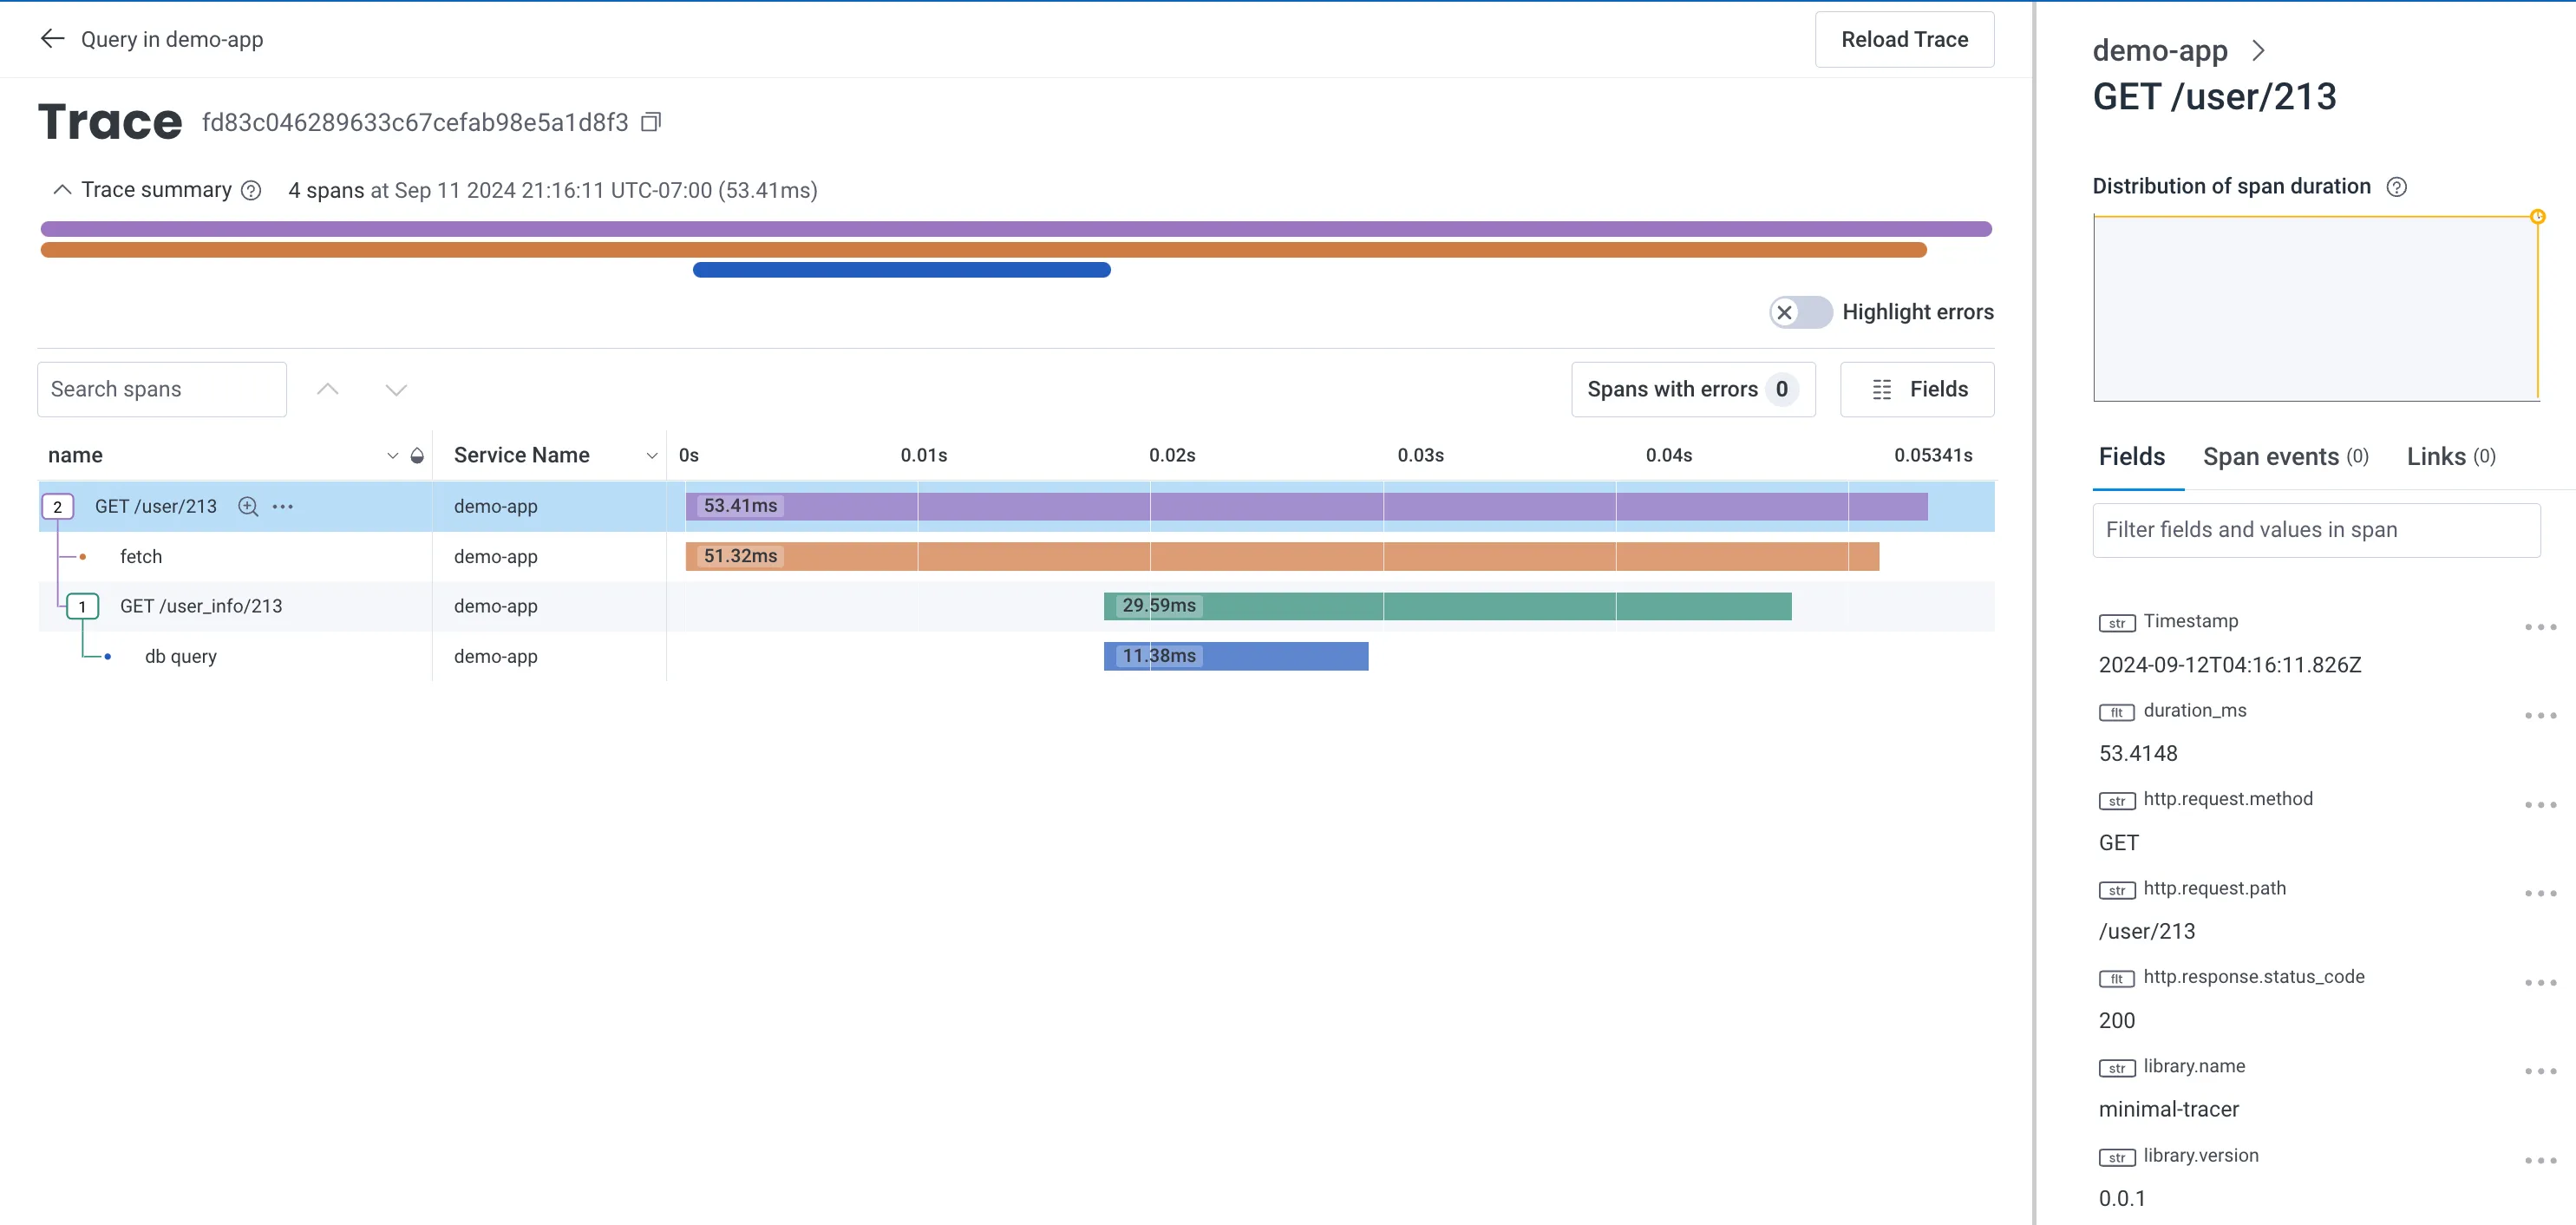
Baselime too!
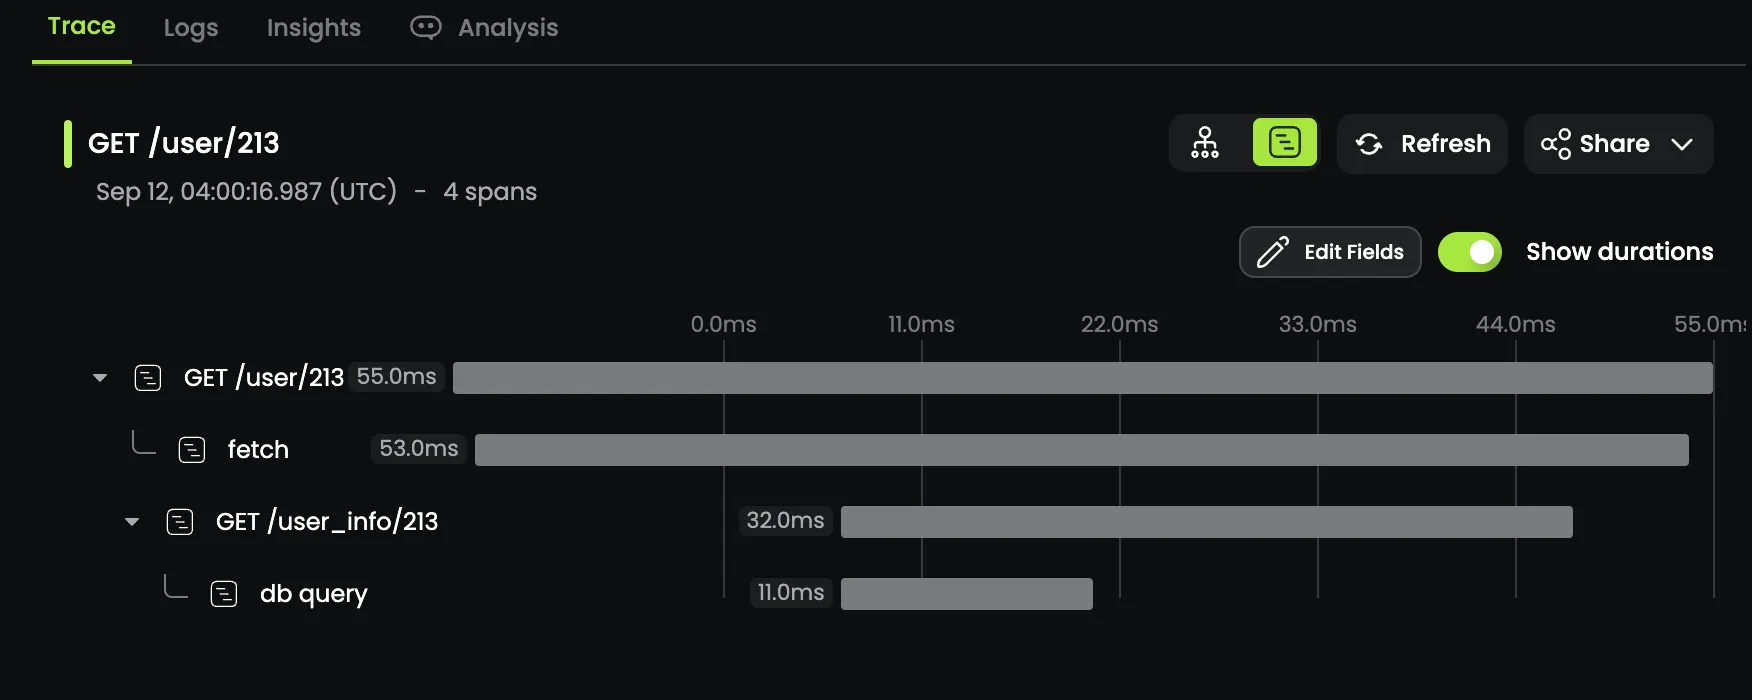
We can visualize our telemetry locally using otel-desktop-viewer!
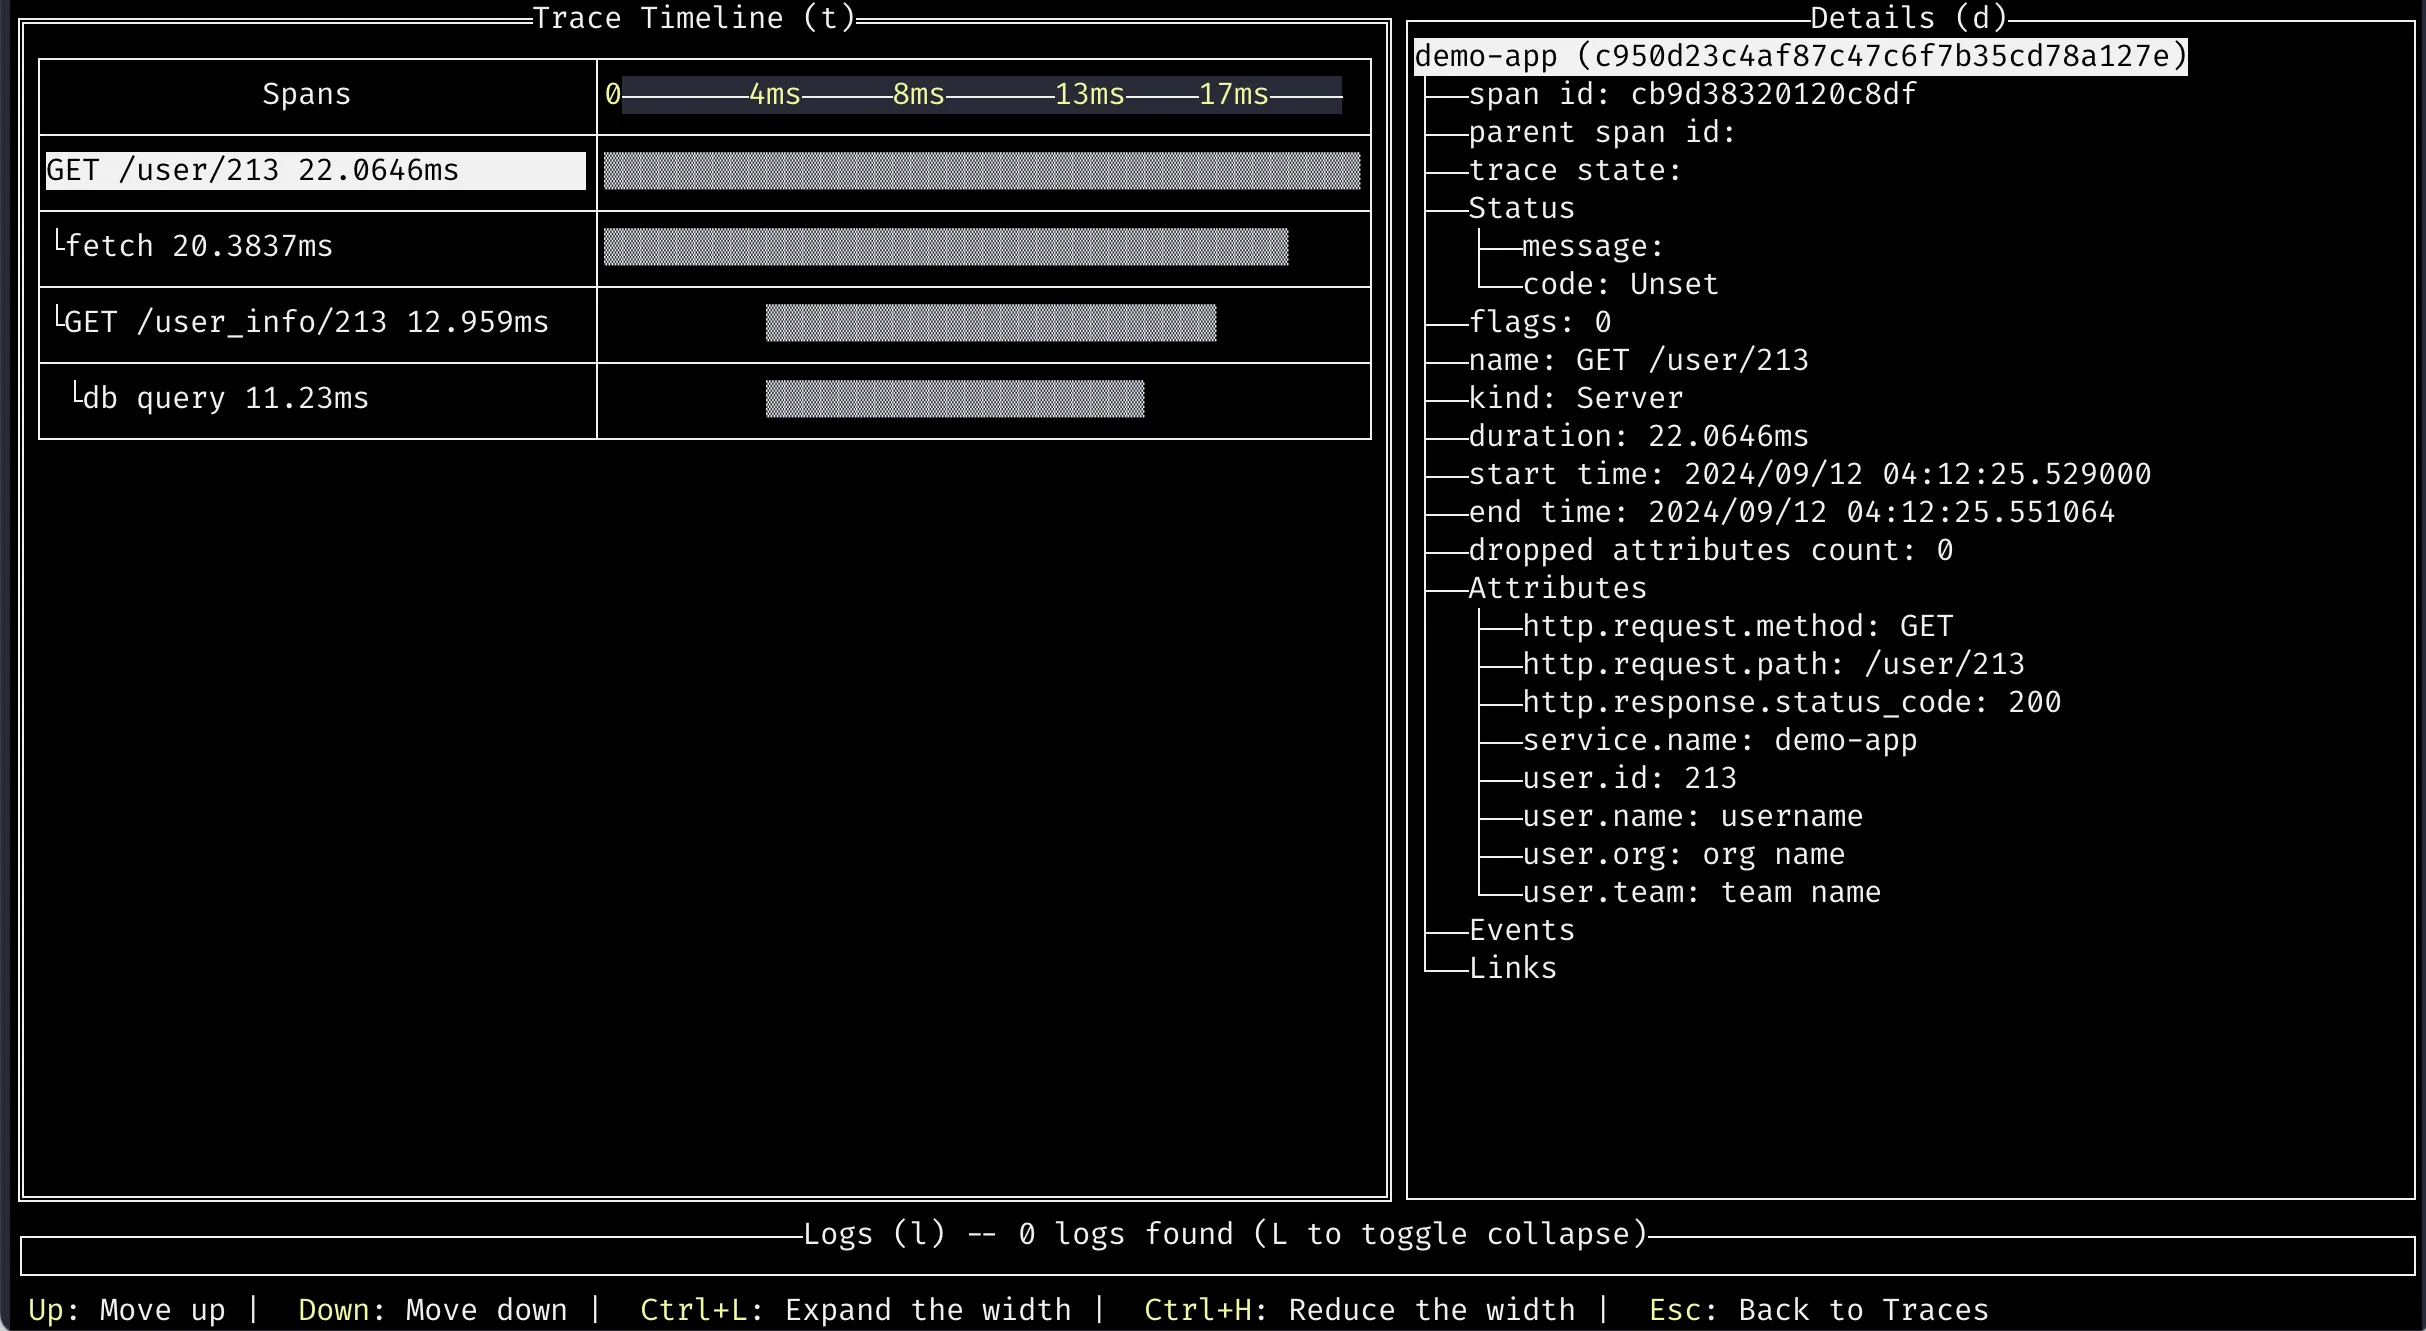
We can even render our data in the terminal with otel-tui
That’s it!?
That’s it! In 181 lines of code we’ve implemented tracing, trace context propagation, instrumentation, and exported it in a standard format that any vendor or tool should be able to accept. Thanks to the magic of 🌈standards🌈.
Is this… you know… legal?
If you were paying attention, there are a lot of OpenTelemetry specifications around how an OpenTelemetry SDK should be structured and behave. Our little library doesn’t do almost any of that. This is just for learning but one could imagine a simplified non-compliant SDK such as this one for Cloudflare Workers. It emits OTLP but doesn’t conform to all of the SDK specifications. How should we think about this?
At the OTel Community Day last June, OpenTelemetry cofounder Ted Young was asked a similar question. I wrote down his answer as best as I could. Lightly paraphrased:
We don’t care about the spec. We care about that the black box participates in tracing and emits OTLP and semantic conventions. The true spec is the data.
I take that to mean, while official SDKs are expected to follow the spec, it’s reasonable for other implementations
to deviate as long as an outside observer cannot tell the difference from the behavior. Our little library does’t quite
pass due to the shortcuts taken in parsing the traceparent header, but it would not take much more code to fix this.
If OpenTelemetry continues to be successful I expect OTLP, the ability to emit and receive it, will get built into everything: your IDE tooling, the platform you deploy on, the framework on which you are building, even hardware. Some day your internet-connected dryer will almost certainly speak OTLP, if it doesn’t already.
Hold on… why is opentelemetry-js so much bigger?
If we can build a functional tracer in under 200 lines, why does the official JavaScript SDK have so much more code?
It might help to go over a non-exhaustive list of things the offical SDK handles that our little learning library doesn’t:
- Buffer and batch outgoing telemetry data in a more efficient format. Don’t send one-span-per-http request in production. Your vendor will want to have words.
- Work in both the browser and in Node environments
- Gracefully handle errors, wrap this library around your core functionality at your own peril
- Be incredibly configurable. Need to do something that isn’t bog standard? You can probably make it happen
- Automagically wrap common libraries in robust, battle-tested instrumentation
- Optimized for performance when used in your code’s tight loops
- Conform to semantic conventions
- Support two whole other types of telemetry: metrics and logging
And more! I hope this post has given you a better mental model for the work happening under all of the production hardening and extensibility that tends to build up on these libraries when they have to be used in the real world. A library that can reliably work across most places we deploy JavaScript and meet a very broad range of user needs is highly non-trivial.
But tracing? We know that’s just ✨fancy logging✨ right?
All code for this post can be found at jmorrell/minimal-nodejs-otel-tracer on Github.
[1] Count the concepts in this simple example
TracerTracerProviderSpanExporterSpanProcessorResourceAttributeEventSpanContext- Both an API and and SDK
- Semantic Conventions
This is intimidating to even senior developers. OpenTelemetry knows this learning curve is a problem and has spun up a new SIG to work on improving the developer experience.