Adopting Wide Event-style instrumentation has been one of the highest-leverage changes I’ve made in my engineering career. The feedback loop on all my changes tightened and debugging systems became so much easier. Systems that were scary to work on suddenly seemed a lot more manageable.
Lately there have been a lot of good blog posts on what “Wide Events” mean and why they are important. Here are some of my recent favorites:
- All you need is Wide Events, not “Metrics, Logs and Traces” by Ivan Burmistrov
- Observability wide events 101 by Boris Tane
- Is it time to version Observability? (Signs point to yes) by Charity Majors
The tl;dr is that for each unit-of-work in your system (usually, but not always an HTTP request / response) you emit one “event” with all of the information you can collect about that work. “Event” is an over-loaded term in telemetry so replace that with “log line” or “span” if you like. They are all effectively the same thing.
Charity Majors has been promoting this approach lately under the name “Observability 2.0”, creating some new momentum around the concept, however, it is not a new idea. Brandur Leach wrote about “Canonical Log Lines” both on his own blog in 2016 and as used by Stripe in 2019. And AWS has recommended it as a best-practice for ages.
Okay… I think I get the idea… but how do I do “wide events”?
This is where I find a lot of developers get tripped up. The idea sounds good in theory, and we should totally try that one day! But I have this stack of features to ship, that bug that’s been keeping me up at night, and 30 new AI tools that came out yesterday to learn about. And like… where do you even start? What data should I add?
Like anything in software, there are a lot of options for how to approach this, but I’ll talk through one approach that has worked for me.
We’ll cover how to approach this in tooling and code, an extensive list of attributes to add, and I’ll respond to some frequent objections that come up when discussing this approach.
For this post we’ll focus on web services, but you would apply a similar approach to any workload.
Choose your tools
We will need some way to instrument your code (traces or structured log lines) and somewhere to send the instrumentation to in order to query and visualize it.
This approach is best paired with a tool that lets you query your data in quick iterations. I like Honeycomb for this, but any Observability tool backed by a modern OLAP database is likely going to work in a pinch.
- Honeycomb has Retriever
- DataDog has Husky
- New Relic has NRDB
- Baselime uses ClickHouse
- SigNoz uses ClickHouse
Honeycomb, New Relic, and DataDog built their own columnar OLAP data stores, though now with the availability of ClickHouse, InfluxDB IOx, Apache Pinot, and DuckDB there are new Observability tools popping up all the time.
If you aren’t constrained, I highly recommend defaulting to using OpenTelemetry and Honeycomb. Your life will be easier.
However even if you are stuck in a corporate environment with a strong allergy to technology built after 2010 you can leverage log search tools like ElasticSearch in a pinch. Stripe’s blog post goes over how to use Splunk for this.
In any tool you want to focus on getting proficient at 3 core techniques in order to sift through your events. The faster you are able to apply these, iterate, and ask questions of your data, the better you’ll be able to debug issues and see what your system is really doing. When observability folks refer to “slicing and dicing” data, this is what they are generally referring to. I’ll represent queries using a made-up SQL dialect, but you should be able to find equivalents in your tool’s query language.
Visualizing
Existing in a human body comes with its fair share of downsides, but the human visual cortex is really, really
good at recognizing patterns. Give it a fighting chance by getting really good at summoning visualizations
of the data your system is emitting. COUNT, COUNT_DISTINCT, HEATMAP, P90, MAX, MIN, Histogram.
Learn to leverage whatever graphs your tool makes available to you. Practice it. Get fast.
Grouping
With each new annotation that we add to our wide events, we create another dimension along which we can
slice our data. GROUP BY allows us to look along that dimension and see if the values along that
dimension match our expectations.
GROUP BY instance.idGROUP BY client.OS, client.versionFiltering
Once we’ve narrowed in one dimension that is interesting, we usually want to dig further into that data. Filtering down so that we’re only looking at data from one endpoint, or from one IP address, or sent by the iOS app, or only from users with a specific feature flag turned on allows us to narrow our focus to a very specific segment of traffic.
WHERE http.route = "/user/account"WHERE http.route != "/health"WHERE http.user_agent_header contains "Android"Write a middleware to help you
If you are using an OpenTelemetry SDK it is already creating a wrapping span around the request and response. You can access it by asking for the active span at any point during the processing of the request.
let span = opentelemetry.trace.getActiveSpan();
span.setAttributes({
  "user_agent.original": c.req.header("User-Agent"),
});
However if anyone wraps any of your code in a child span the “active span” will change to be that new wrapping span! There is no first-class way of addressing this original “main” span in OpenTelemetry. However, we can work around this by saving a reference to this specific span in the context so we can always have access to the “main” wrapping span.
// create a reference to store the span on the opentelemetry context object
const MAIN_SPAN_CONTEXT_KEY = createContextKey("main_span_context_key");

function mainSpanMiddleware(req, res, next) {
  // pull the active span created by the http instrumentation
  let span = trace.getActiveSpan();

  // get the current context
  let ctx = context.active();

  // set any attributes we always want on the main span
  span.setAttribute("main", true);

  // OpenTelemetry context is immutable, so to modify it we create
  // a new version with our span added
  let newCtx = ctx.setValue(MAIN_SPAN_CONTEXT_KEY, span);

  // set that new context as active for the duration of the request
  context.with(newCtx, () => {
    next();
  });
}

// create another function that allows you to annotate this saved span easily
function setMainSpanAttributes(attributes) {
  let mainSpan = context.active().getValue(MAIN_SPAN_CONTEXT_KEY);
  if (mainSpan) {
    mainSpan.setAttributes(attributes);
  }
}
Now our annotation code can look a little simpler, and we can always know that we’re setting these attributes on the wrapping span.
setMainSpanAttributes({
  "user.id": "123",
  "user.type": "enterprise",
  "user.auth_method": "oauth",
});
You can play around with a minimal running example here.
At Heroku we had internal OpenTelemetry Distributions that set this up for you automatically and added as many automatic annotations as possible to these spans.
If you are not using OpenTelemetry here’s a gist that might help you get started. My previous post may help you put this logic together.
What do I add to this “main” span?
And how many dimensions do you plan to emit and pack into your wide events?
— Charity Majors (@mipsytipsy) January 9, 2024
MANY. Hundreds! The more you have, the better you can detect and correlate rare conditions with precision.
As you adjust to the joys of debugging with rich context, you will itch for it everywhere. ☺️
We need to add attributes about the request, and there are likely far more of these than you would expect. It’s easy to come up with a dozen or so, but in a well-instrumented code base there will be hundreds of attributes.
Note that while this is a long list, it is definitely not exhaustive. OpenTelemetry defines sets of attribute names as Semantic Conventions that can also be used for inspiration. I have tried to follow these in my naming where possible.
A convention to filter out everything else
Traces contain lots of spans, so it’s helpful to have a convention for identifying and searching for these “wide events”.
root and canon were floated as options, but I’ve landed on calling them main spans.
| Attribute | Examples | Description |
|---|---|---|
main | true | Present only for spans designated as a “wide event”, usually wrapping a request / response, or a background job |
This convention allows you to quickly figure out “what does the traffic to this service look like?” with a single query:
SELECT
  COUNT(*)
WHERE
  main = true
GROUP BY http.route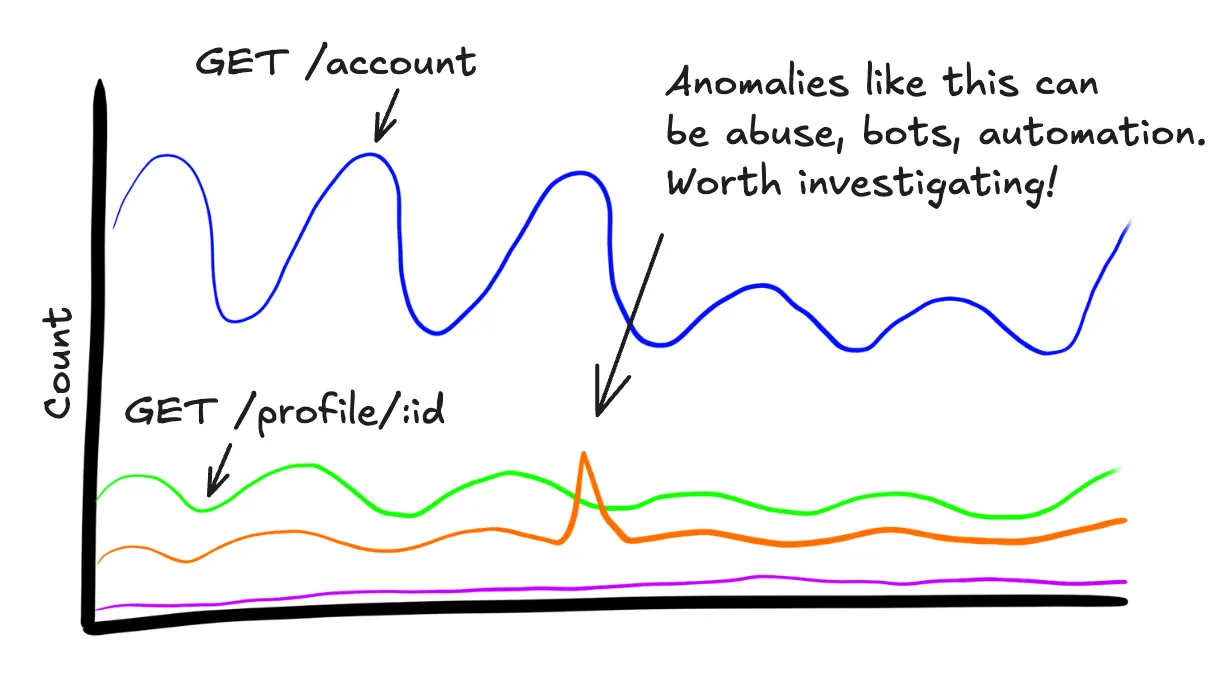
Service metadata
Of course we need to add some information about the service we’re running. Consider adding additional metadata about which team owns the system, or which Slack channel the owning team hangs out in, though note that this can be tedious to update if your workplace experiences frequent re-orgs. Tying these to a service catalog like Backstage is left as an exercise to the reader.
| Attribute | Examples | Description |
|---|---|---|
service.name | api shoppingcart | What is the name of this service? |
service.environment | production staging development | Where is this service running? |
service.team | web-services dev-ex | Which team owns this service. Useful for knowing who to page in during incidents. |
service.slack_channel | web-services dev-ex | If I discover an issue with this service, where should I reach out? |
How many services does each team run?
SELECT
  COUNT_DISTINCT(service.name)
WHERE
  service.environment = "production"
GROUP BY service.team
Ever look at the load on a system and then wonder “Is that appropriate for the machine this is running on?”, and now you have to look through other tools or config files to get that information. Throw that context on the wide event so that it’s available when you need it.
| Attribute | Examples | Description |
|---|---|---|
instance.id | 656993bd-40e1-4c76-baff-0e50e158c6eb | An ID that maps to this one instance of the service |
instance.memory_mb | 12336 | How much RAM is available to this service? |
instance.cpu_count | 4 8 196 | How many cores are available to this service? |
instance.type | m6i.xlarge | Does your vendor have a name for this type of instance? |
What are the services with the most memory that we run? What instance types do they use?
SELECT
  service.name,
  instance.memory_mb,
  instance.type
ORDER BY instance.memory_mb DESC
GROUP BY service.name, instance.type
LIMIT 10
However you’re orchestrating your systems make sure that all of the relevant information is added. I’ve included some examples from the Kubernetes semantic conventions for inspiration.
| Attribute | Examples | Description |
|---|---|---|
container.id | a3bf90e006b2 | An ID used to identify Docker containers |
container.name | nginx-proxy wordpress-app | Container name used by container runtime |
k8s.cluster.name | api-cluster | Name of the kubernetes cluster your service is running in |
k8s.pod.name | nginx-2723453542-065rx | Name of the kubernetes pod your service is running in |
cloud.availability_zone | us-east-1c | AZ where you’re running your service |
cloud.region | us-east-1 | Region where you’re running your service |
But even if you’re using a Platform-as-a-Service you can still pull out a lot of useful information!
| Attribute | Examples | Description |
|---|---|---|
heroku.dyno | web.1 worker.3 | The env var DYNO that is set on your app at runtime |
heroku.dyno_type | web worker | The first part of the DYNO env var before the .. Separating this makes it easier to query |
heroku.dyno_index | 1 3 | The second part of the DYNO env var after the .. Separating this makes it easier to query |
heroku.dyno_size | performance-m | The selected dyno size |
heroku.space | my-private-space | The name of the private space that your are deployed into |
heroku.region | virginia oregon | Which region is this app located in? |
How many dynos are we running? What dyno types are they? For which services?
SELECT
  COUNT_DISTINCT(heroku.dyno_index)
GROUP BY service.name, heroku.dyno_type, instance.type
Build info
Inevitably some of the first questions asked in any incident are “Did something just go out?” or “What changed?”. Instead of jumping to your deployment tool or looking through GitHub repositories, add that data to your telemetry.
Threading this data from your build system through to your production system so that it’s available at runtime can be a non-trivial amount of glue code, but having this information easily available during incidents is invaluable.
| Attribute | Examples | Description |
|---|---|---|
service.version | v123 9731945429d3d083eb78666c565c61bcef39a48f | However you track your version, ex: a version string or a hash of the built image |
service.build.id | acd8bb57-fb9f-4b2d-a750-4315e99dac64 | If your build system gives you an ID, this context allows you to audit the build if something goes wrong |
service.build.git_hash | 6f6466b0e693470729b669f3745358df29f97e8d | The git SHA of the deployed commit so you can know exactly which code was running |
service.build.pull_request_url | https://github.com/your-company/api-service/pull/121 | The url of the pull request that was merged that triggered the deploy |
service.build.diff_url | https://github.com/your-company/api-service/compare/c9d9380..05e5736 | A url that compares the previously deployed commit against the newly deployed commit |
service.build.deployment.at | 2024-10-14T19:47:38Z | Timestamp when the deployment process started |
service.build.deployment.user | keanu.reeves@your-company.com | Which authenticated user kicked off the build? Could be a bot |
service.build.deployment.trigger | merge-to-main slack-bot api-request config-change | What triggered the deploy? Extremely valuable context during an deploy-triggered incident |
service.build.deployment.age_minutes | 1 10230 | How old is this deploy? Shortcuts the frequent incident question “Did something just go out?” |
Won’t this be a lot of repetitive data? These values do not change except between deploys! See Frequent Objections
What systems have recently been deployed?
SELECT
  service.name,
  MIN(service.build.deployment.age_minutes) as age
WHERE
  service.build.deployment.age_minutes < 20
GROUP BY service.name
ORDER BY age ASC
LIMIT 10
What’s up with the spike of 500s when we did the last deploy?
SELECT
  COUNT(*)
WHERE
  service.name = "api-service" AND
  main = true
GROUP BY http.status_code, service.version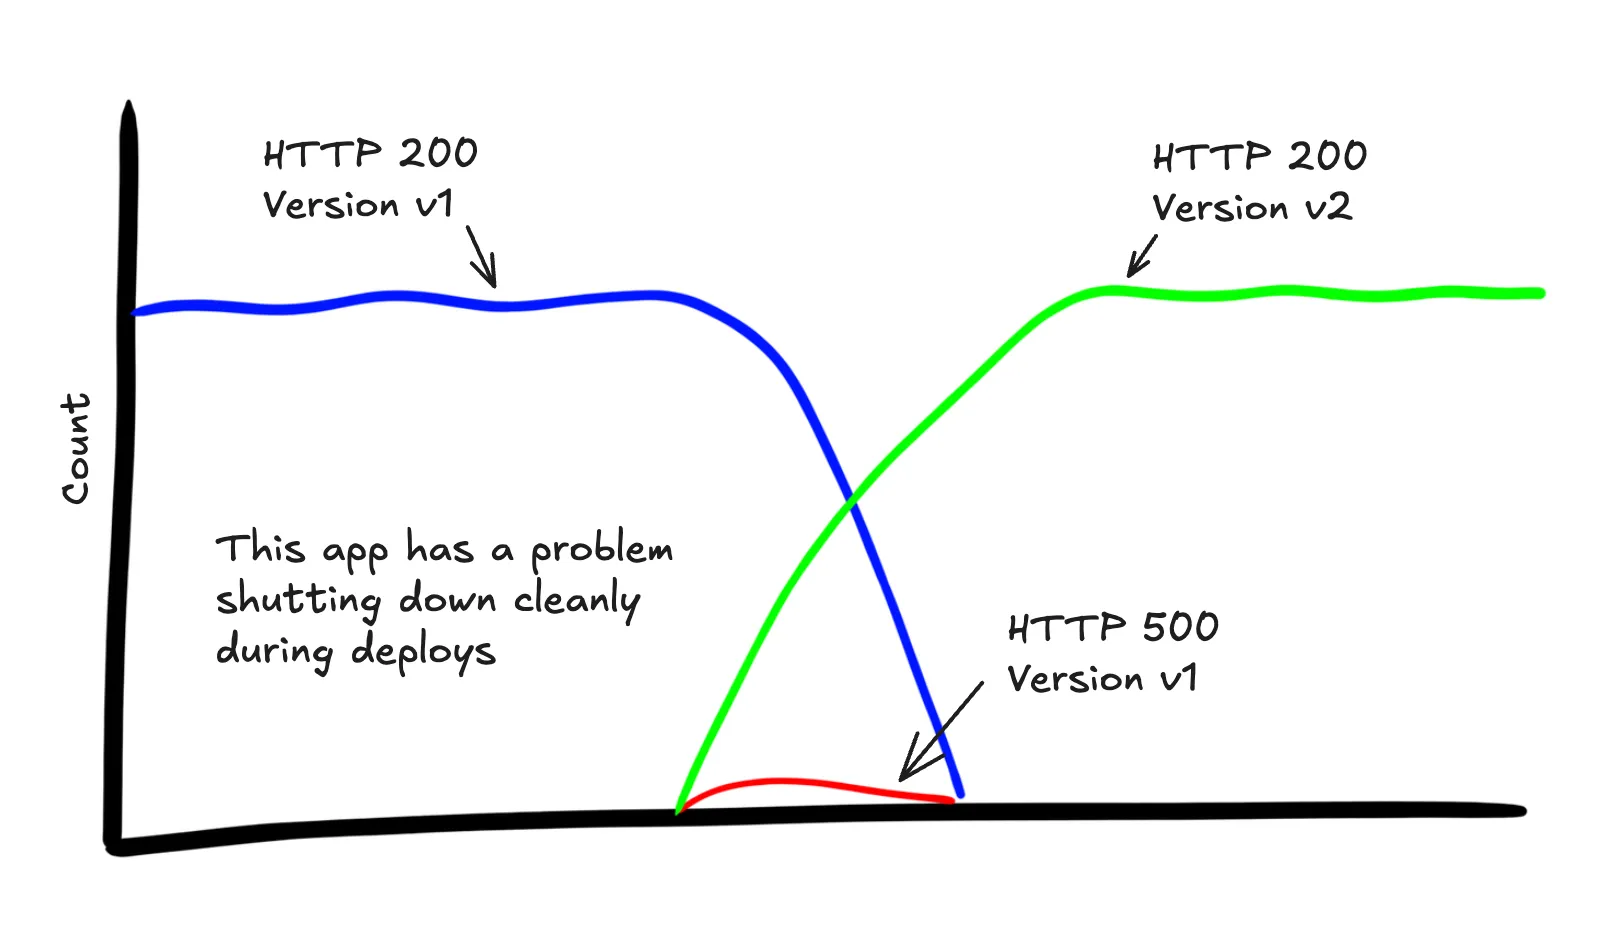
HTTP
You should get most of these from your tracing library instrumentation, but there are usually more you can add if, for example, your organization uses non-standard headers. Don’t settle for only what OpenTelemetry gives you by default!
| Attribute | Examples | Description |
|---|---|---|
server.address | example.com localhost | Name of the HTTP server that received the request |
url.path | /checkout /account/123/features | URI path after the domain |
url.scheme | http, https | URI scheme |
url.query | q=test, ref=#### | URI query component |
http.request.id | 79104EXAMPLEB723 | Platform request id: ex: x-request-id, x-amz-request-id |
http.request.method | GET PUT POST OPTIONS | HTTP request method |
http.request.body_size | 3495 | Size of the request payload body in bytes |
http.request.header.content-type | application/json | Value of a specific request header, “content-type” in this case, but there are many more. Pick out any that are important for your service |
http.response.status_code | 200 404 500 | HTTP response status code |
http.response.body_size | 1284 2202009 | Size of the response payload body in bytes |
http.request.header.content-type | text/html | Value of a specific response header, “content-type” in this case, but there are many more. Pick out any that are important for your service |
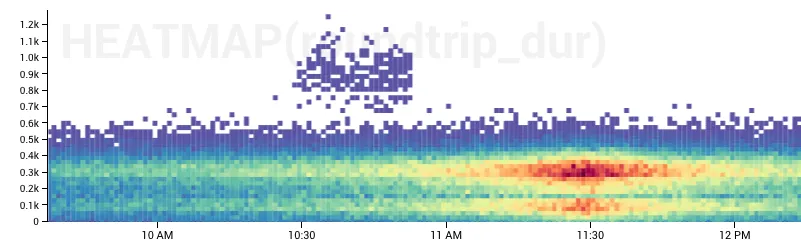
SELECT
  HEATMAP(http.response.body_size),
WHERE
  main = true AND
  service.name = "api-service"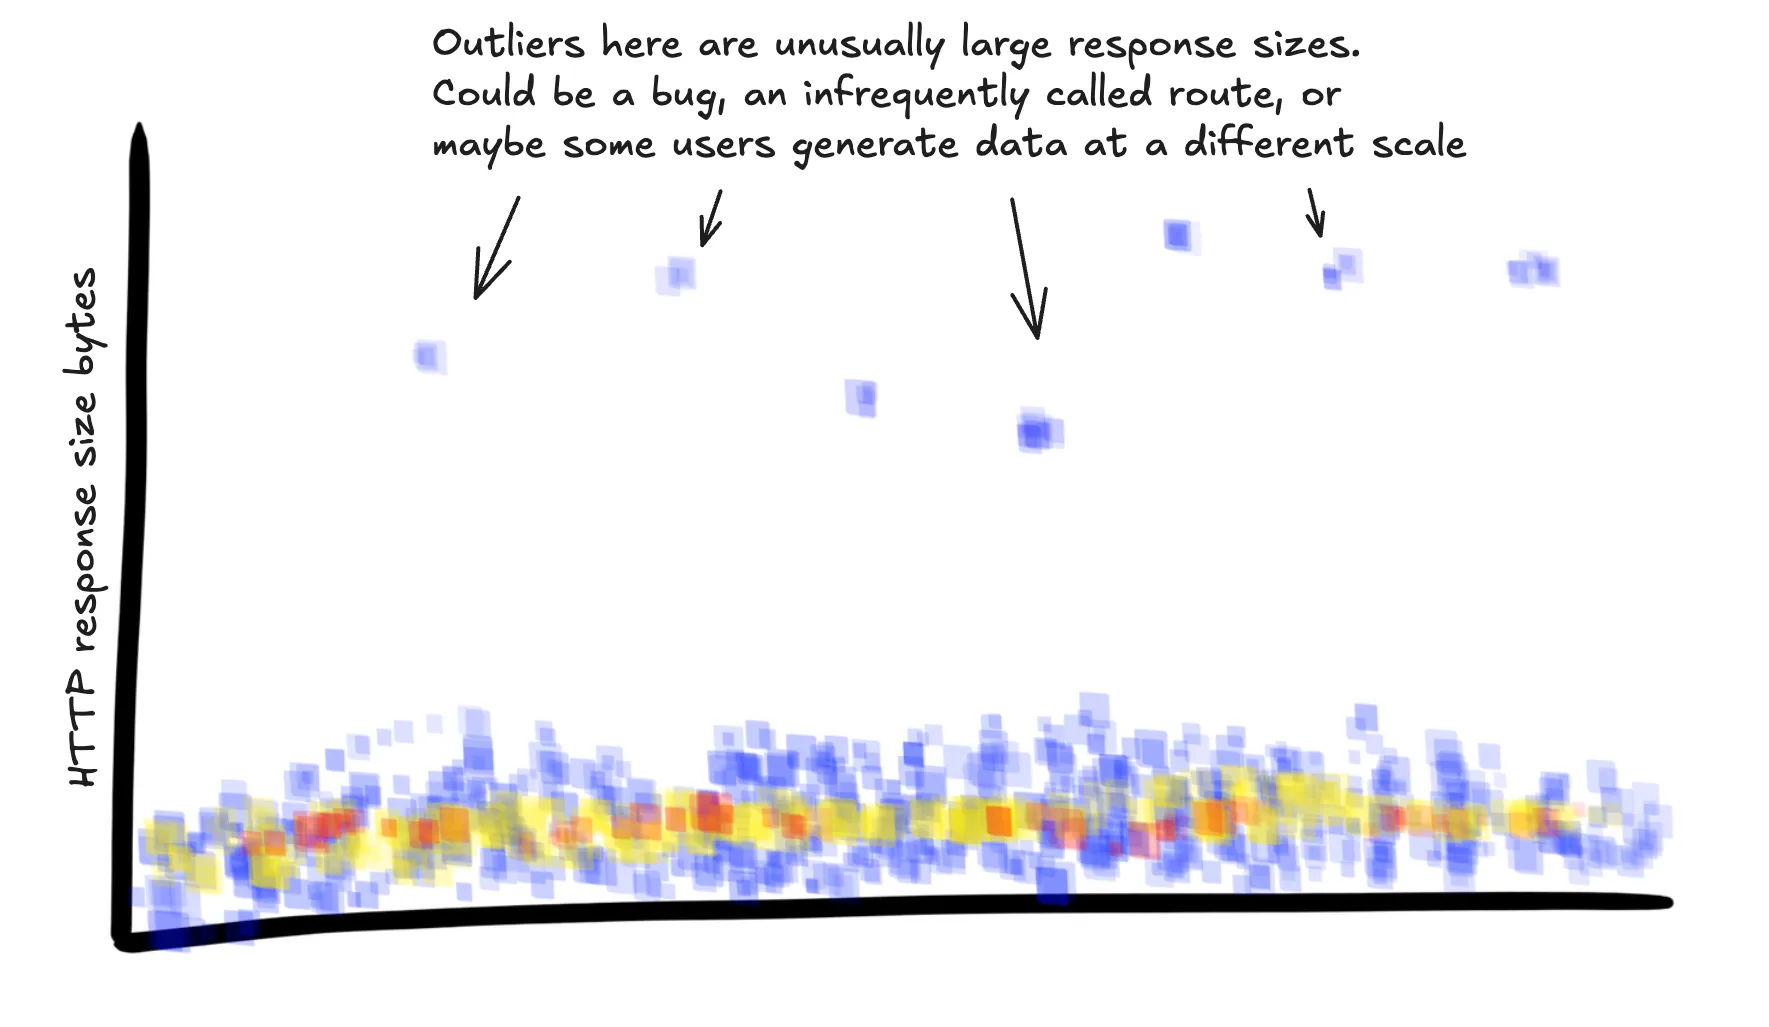
User-Agent headers contain a wealth of info. Don’t rely on regex queries to try and make sense of them down the road. Parse them
into structured data from the beginning.
| Attribute | Examples | Description |
|---|---|---|
user_agent.original | Mozilla/5.0 (Windows NT 10.0; Win64; x64) AppleWebKit/537.36 (KHTML, like Gecko) Chrome/129.0.0.0 Safari/537.3 | The value of the HTTP User-Agent header |
user_agent.device | computer tablet phone | Device type derived from the User-Agent header |
user_agent.OS | Windows MacOS | OS derived from the User-Agent header |
user_agent.browser | Chrome Safari Firefox | Browser derived from the User-Agent header |
user_agent.browser_version | 129 18.0 | Browser version derived from the User-Agent header |
What browsers are my users using?
SELECT
  COUNT(*)
GROUP BY user_agent.browser, user_agent.browser_version
If you have any custom user agents or headers used as a convention within your org parse that out too.
| Attribute | Examples | Description |
|---|---|---|
user_agent.service | api-gateway auth-service | If you have a distributed architecture, have each service send a custom User-Agent header with its name and version |
user_agent.service_version | v123 6f6466b0e693470729b669f3745358df29f97e8d | If you have a distributed architecture, have each service send a custom User-Agent header with its name and version |
user_agent.app | iOS android | If a request is coming from a mobile app, make sure it includes which app and its version |
user_agent.app_version | v123 6f6466b0e693470729b669f3745358df29f97e8d | If a request is coming from a mobile app, make sure it includes which app and its version |
Route info
We’re not done with HTTP attributes yet! One of the most important bits is the API endpoint that the request matched. OpenTelemetry SDKs will usually give this to you automagically but not always. Consider extracting the route parameters and query parameters as additional attributes.
| Attribute | Examples | Description |
|---|---|---|
http.route | /team/{team_id}/user/{user_id} | The route pattern that the url path is matched against |
http.route.param.team_id | 14739 team-name-slug | The extracted segment of the url path as it is parsed for each parameter |
http.route.query.sort_dir | asc | The query parameters that are relevant to the response of your service. Ex: ?sort_dir=asc&... |
SELECT
  P99(duration_ms)
WHERE
  main = true AND
  service.name = "api-service"
GROUP BY http.route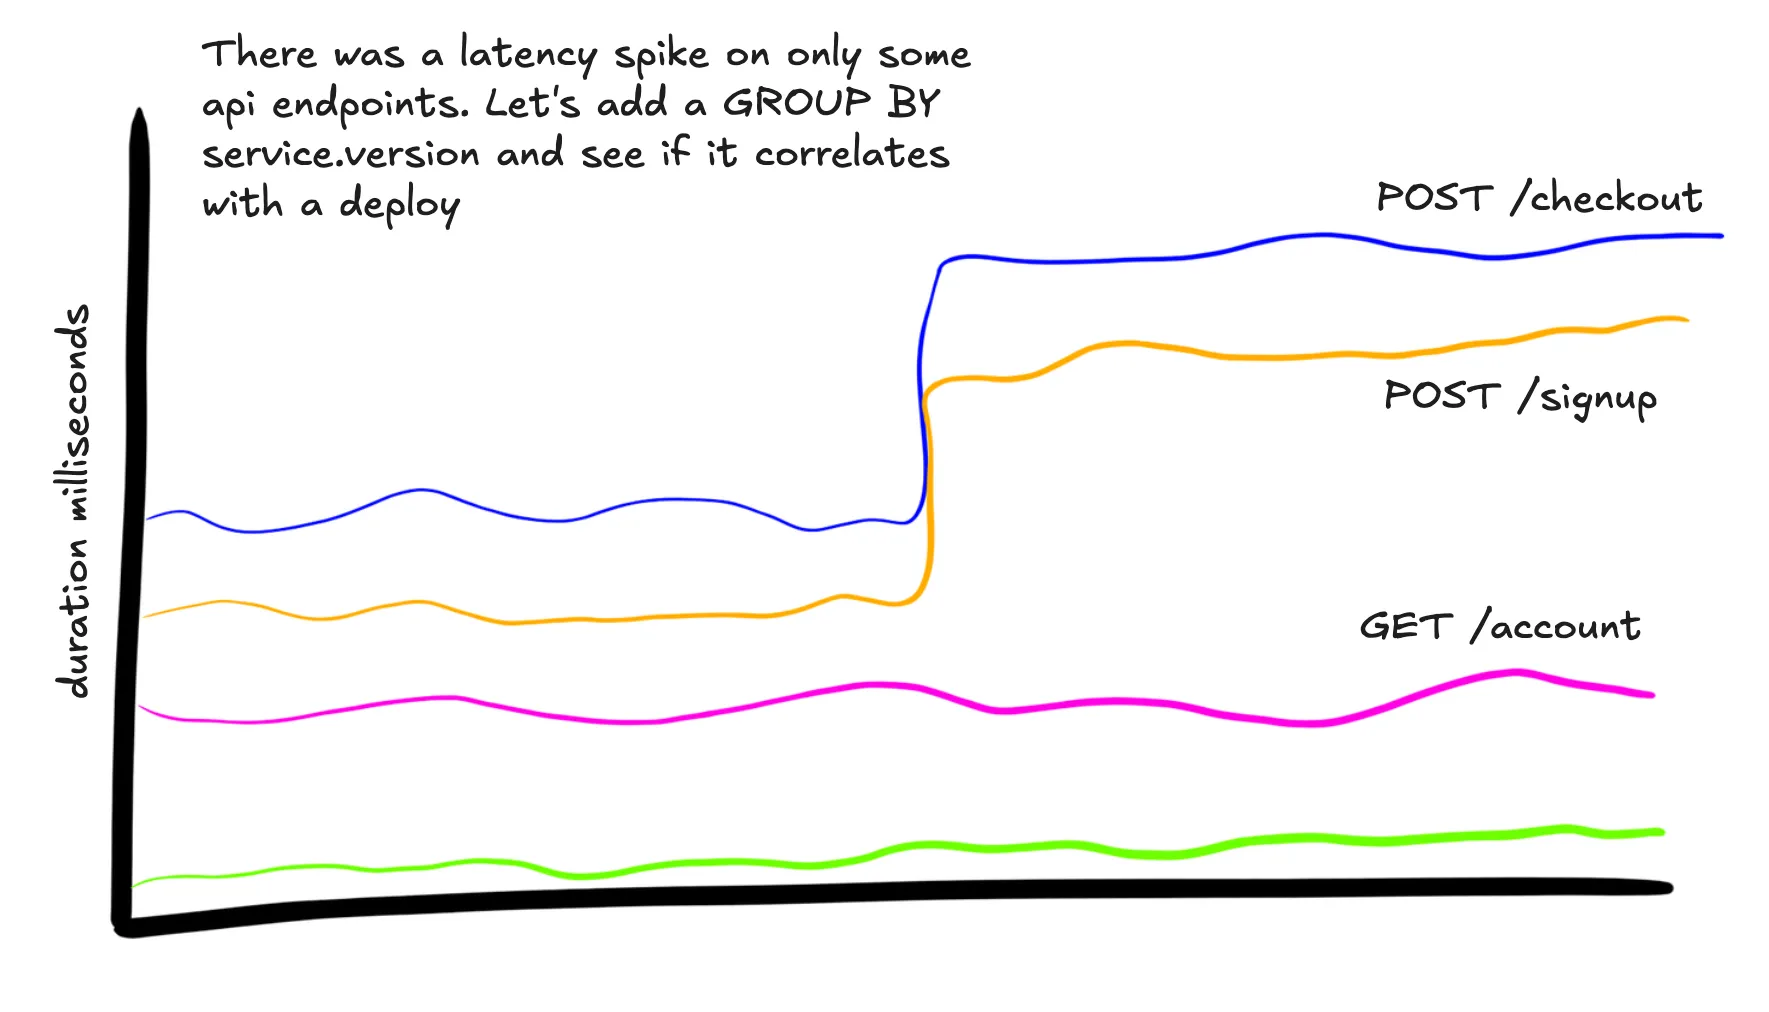
User and customer info
Once you get the basics down, this is the most important piece of metadata that you can add. No automagic SDK will be able to encode the particulars of your user model.
It’s common for a single user or account to be responsible for a 10%+ of a business’ revenue, and frequently their usage patterns look significantly different than the average user. They probably have more users, store more data, and hit limits and edge-cases that will never show up for the user paying $10 / month. Be sure you can separate their traffic from others.
| Attribute | Examples | Description |
|---|---|---|
user.id | 2147483647 user@example.com | The primary ID for a user. If this is an email and you’re using a vendor, consider your org’s policy on putting PII in external services. |
user.type | free premium enterprise vip | How does the business see this type of user? Individual accounts are sometimes responsible for 10%+ of a business’ income. Make sure you can separate their traffic from others! |
user.auth_method | token basic-auth jwt sso-github | How did this user authenticate into your system? |
user.team.id | 5387 web-services | If you have a team construct, which one does this user belong to? |
user.org.id | 278 enterprise-name | If this user is part of an organization with an enterprise contract, track that! |
user.age_days | 0 637 | Not the user’s literal age, but how long ago was this account created? Is this an issue experienced by someone new to your app, or only once they’ve saved a lot of data? |
user.assumed | true | Have an internal way of assuming a user’s identity for debugging? Be sure to track this |
user.assumed_by | engineer-3@your-company.com | And track which actual user is assuming the user’s identity |
SELECT
  P99(duration_ms)
WHERE
  main = true AND
  service.name = "api-service"
GROUP BY user.type
Rate limits
Whatever your rate limiting strategy, make sure the current rate limit info gets added too. Can you quickly find examples of users that are being rate-limited by your service?
| Attribute | Examples | Description |
|---|---|---|
ratelimit.limit | 200000 | You might not now, but you will likely have users with different rate limits in the future, note down what the actual limit is for this request |
ratelimit.remaining | 130000 | What is the budget remaining for this user? |
ratelimit.used | 70000 | How many requests have been used in the current rate window |
ratelimit.reset_at | 2024-10-14T19:47:38Z | When will the rate limit be reset next? if applicable |
This user has a support ticket open about being rate-limited. Let’s see what they were doing
SELECT
  COUNT(*)
WHERE
  main = true AND
  service.name = "api-service" AND
  user.id = 5838
GROUP BY http.route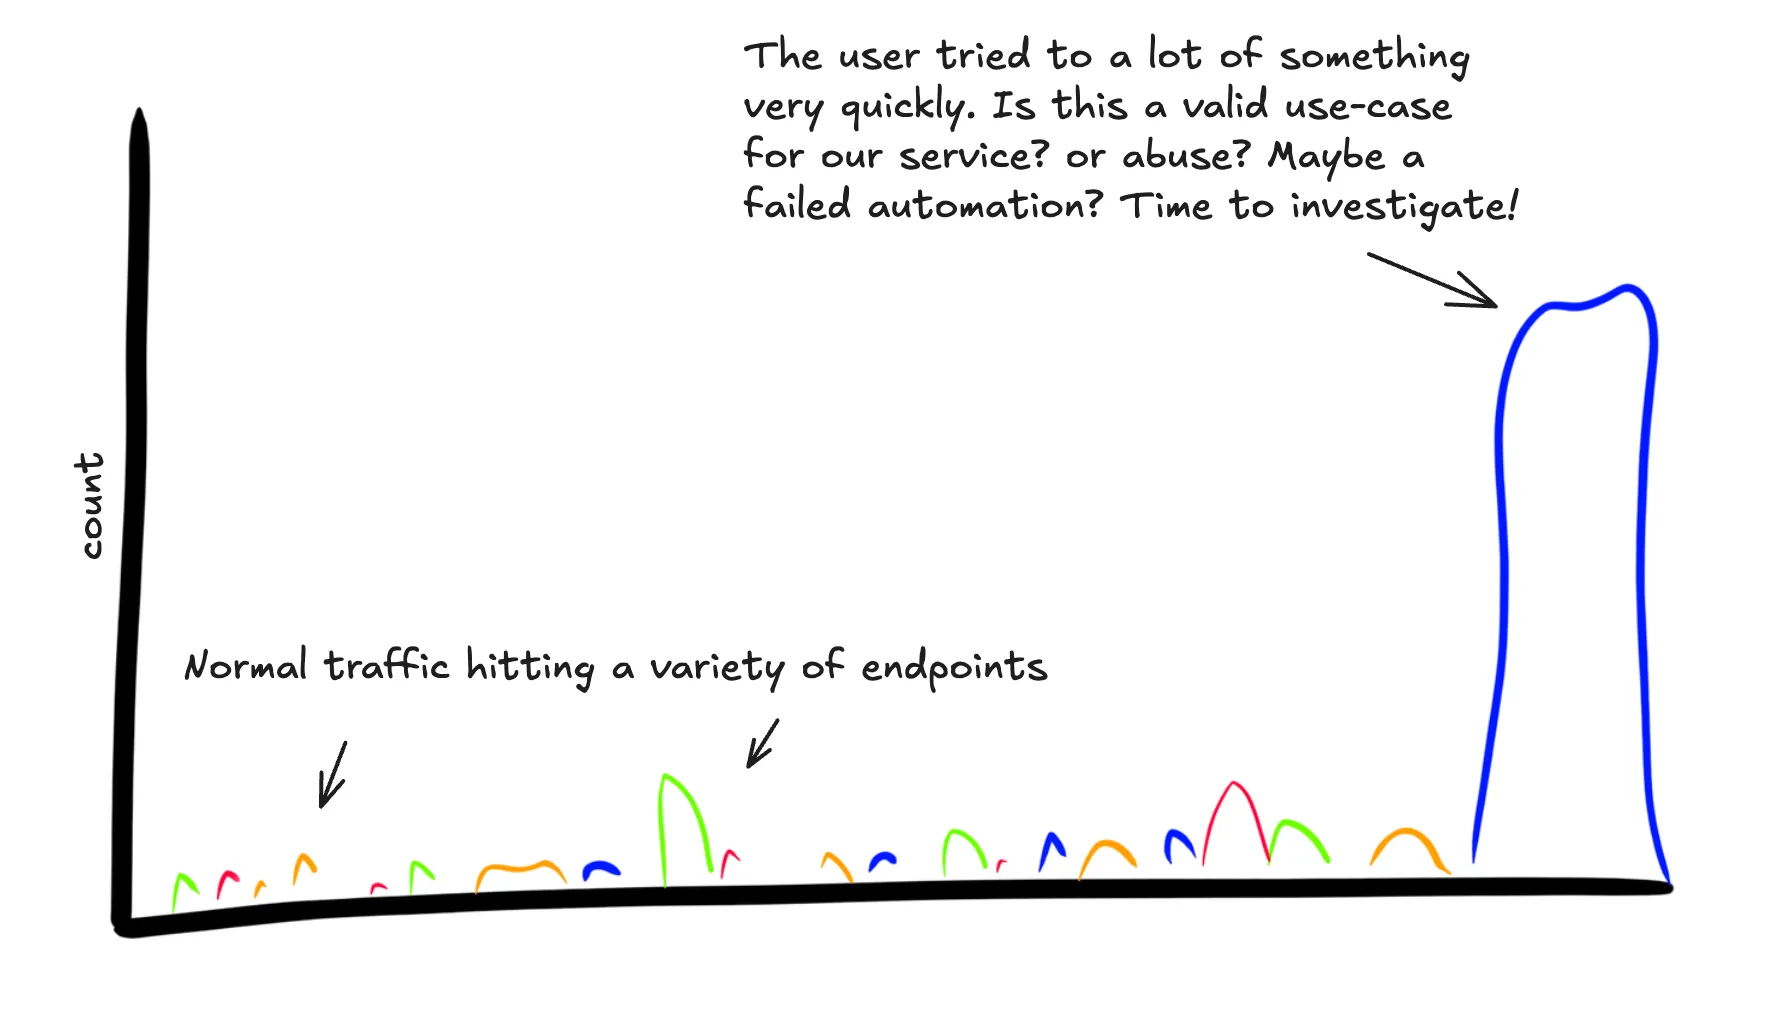
What routes are users who have burned most of their rate limit hitting? Does this activity look suspicious?
SELECT
  COUNT(*)
WHERE
  main = true AND
  service.name = "api-service" AND
  ratelimit.remaining < 100
GROUP BY http.route
Caching
For every code path where we could shortcut with a cache response, add whether or not it was successful
| Attribute | Examples | Description |
|---|---|---|
cache.session_info | true false | Was the session info cached or did it need to be re-fetched? |
cache.feature_flags | true false | Were the feature flags cached for this user or did they need to be re-fetched? |
Localization info
What localization options has the user chosen? This can be a frequent source of bugs
| Attribute | Examples | Description |
|---|---|---|
localization.language_dir | rtl, ltr | Which direction is text laid out in their language? |
localization.country | mexico, uk | Which country are they from? |
localization.currency | USD, CAD | Which currency have they chosen to work with? |
Uptime
Tracking how long the service has been running when it serves a request can help you visualize several classes of bugs:
- Issues that show up on a reboot
- Memory leaks that only start to show up when the service has been running for a long time
- Frequent crashes / restarts if you have automatically restart the service on failure
I recommend also either adding the log10 of the uptime or having some way of visualizing this. When graphed this emphasizes
the important first few minutes of a service without being squished into the bottom of the graph by instances with several days
or more of uptime.
| Attribute | Examples | Description |
|---|---|---|
uptime_sec | 1533 | How long has this instance of your app been running? Can be useful to visualize to see restarts |
uptime_sec_log_10 | 3.185 | Grows sub-linearly which allows you to visualize long-running services and brand new ones on the same graph |
SELECT
  HEATMAP(uptime_sec),
  HEATMAP(uptime_sec_log_10)
WHERE
  main = true AND
  service.name = "api-service"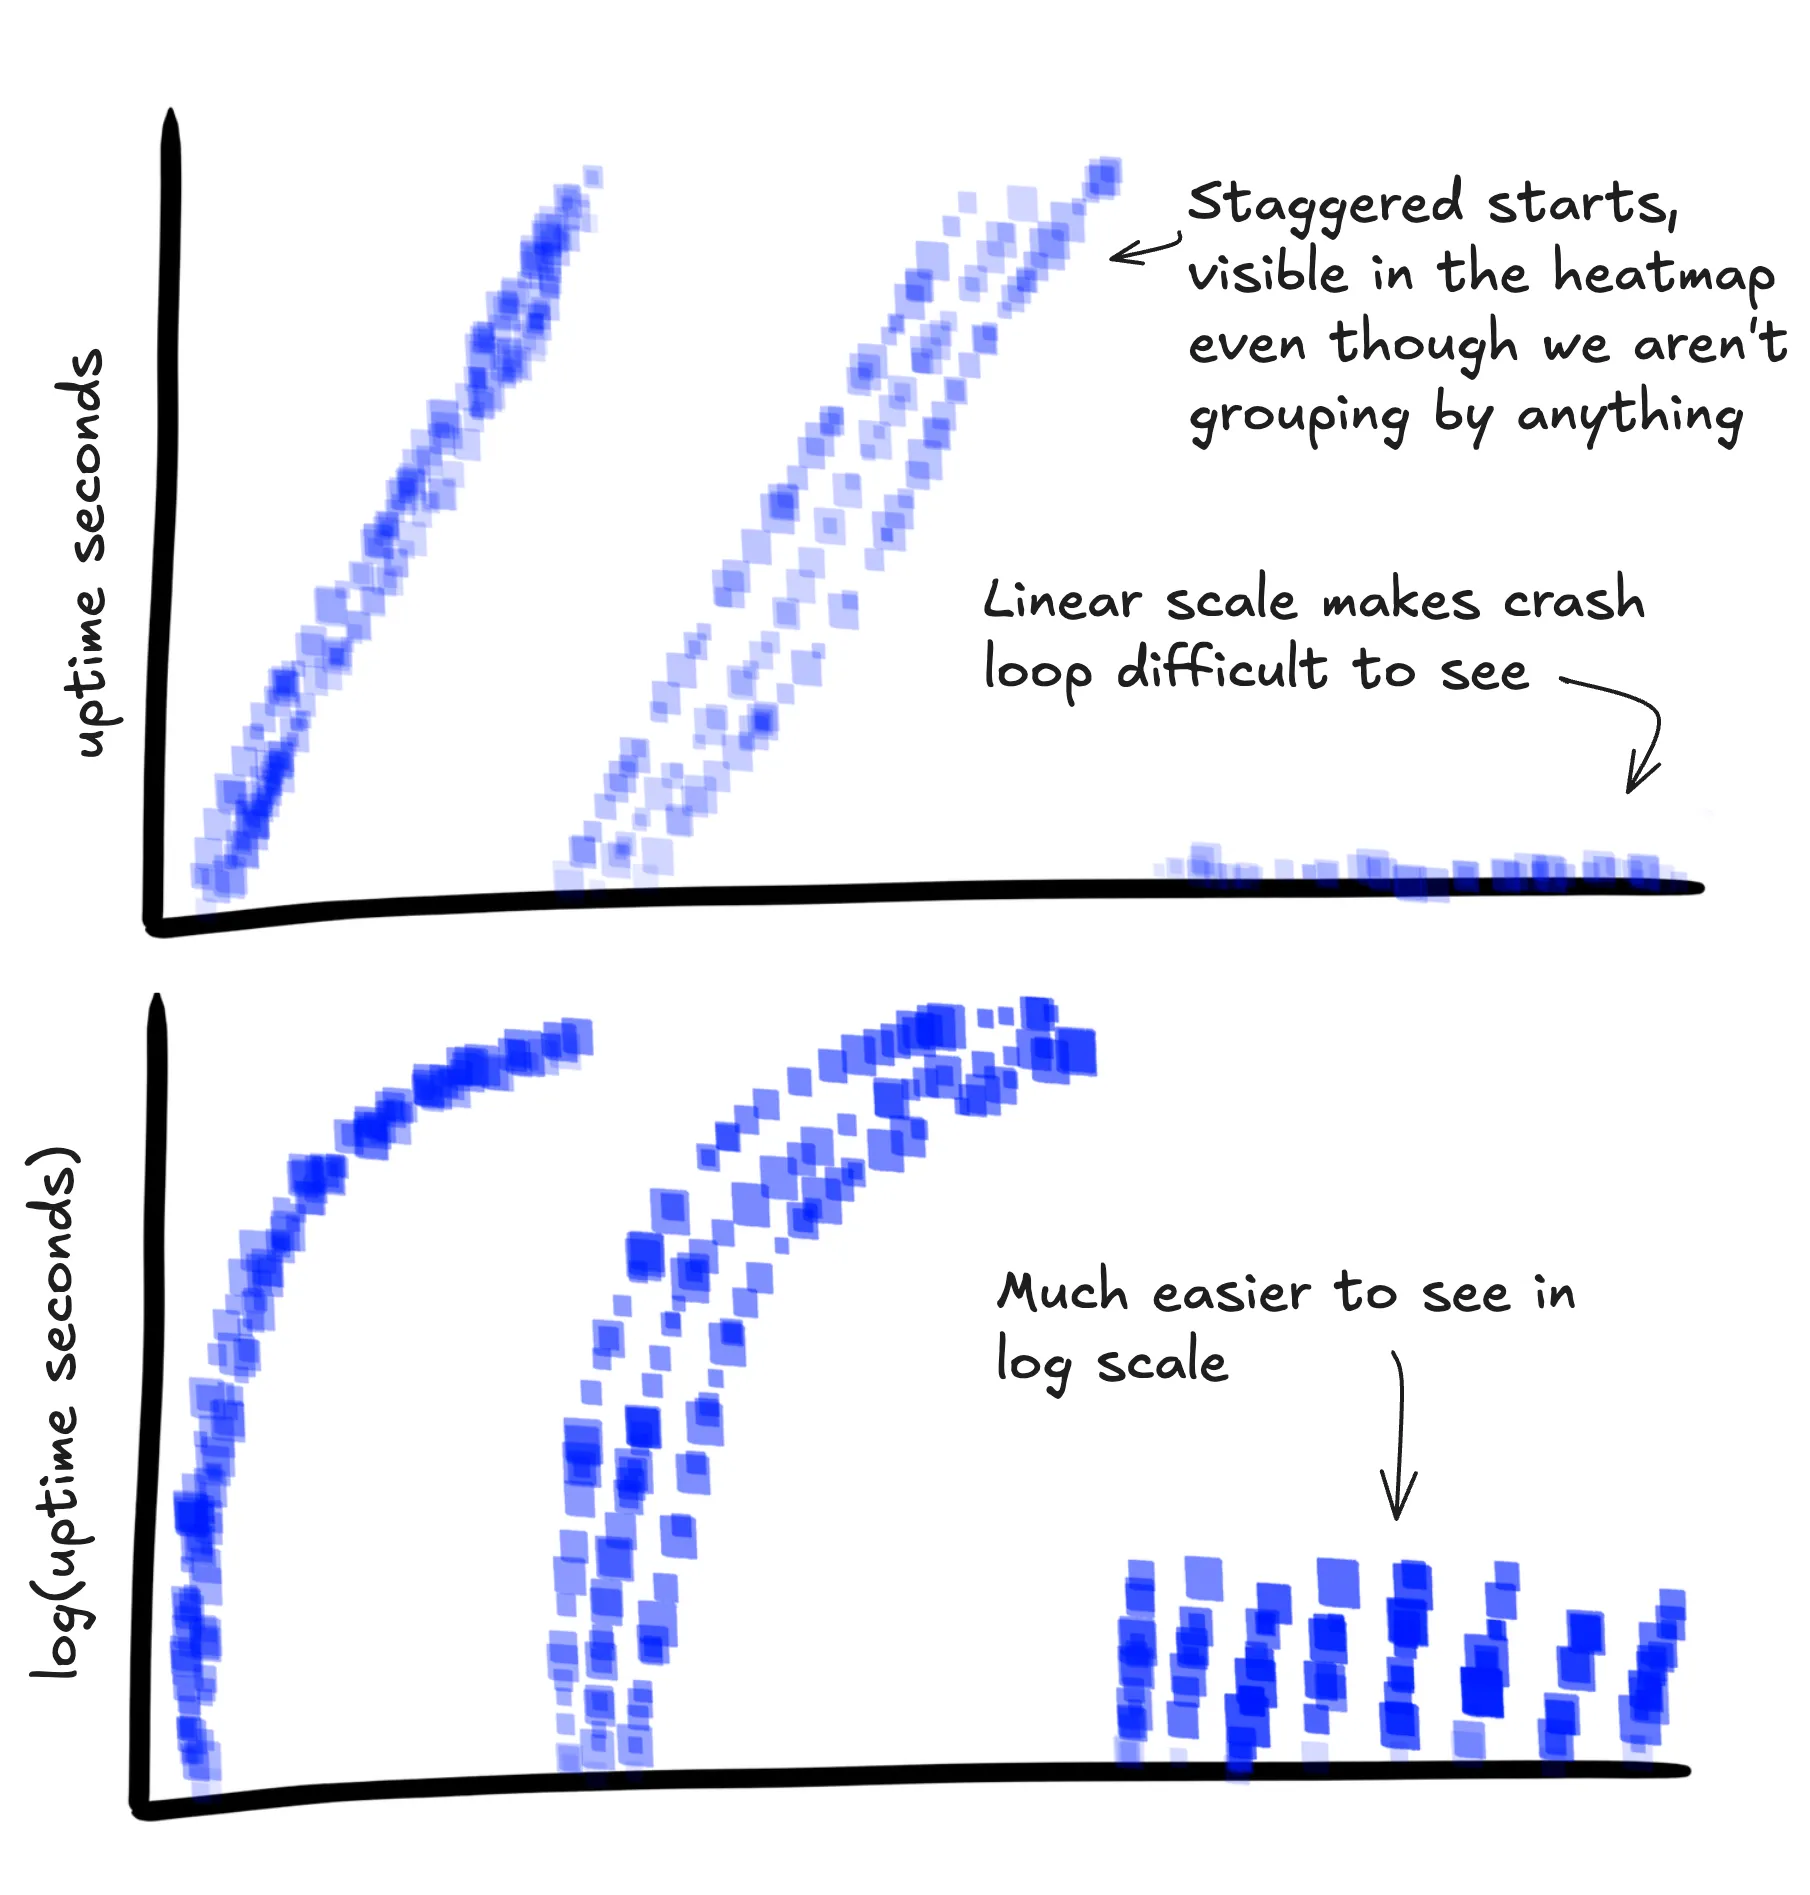
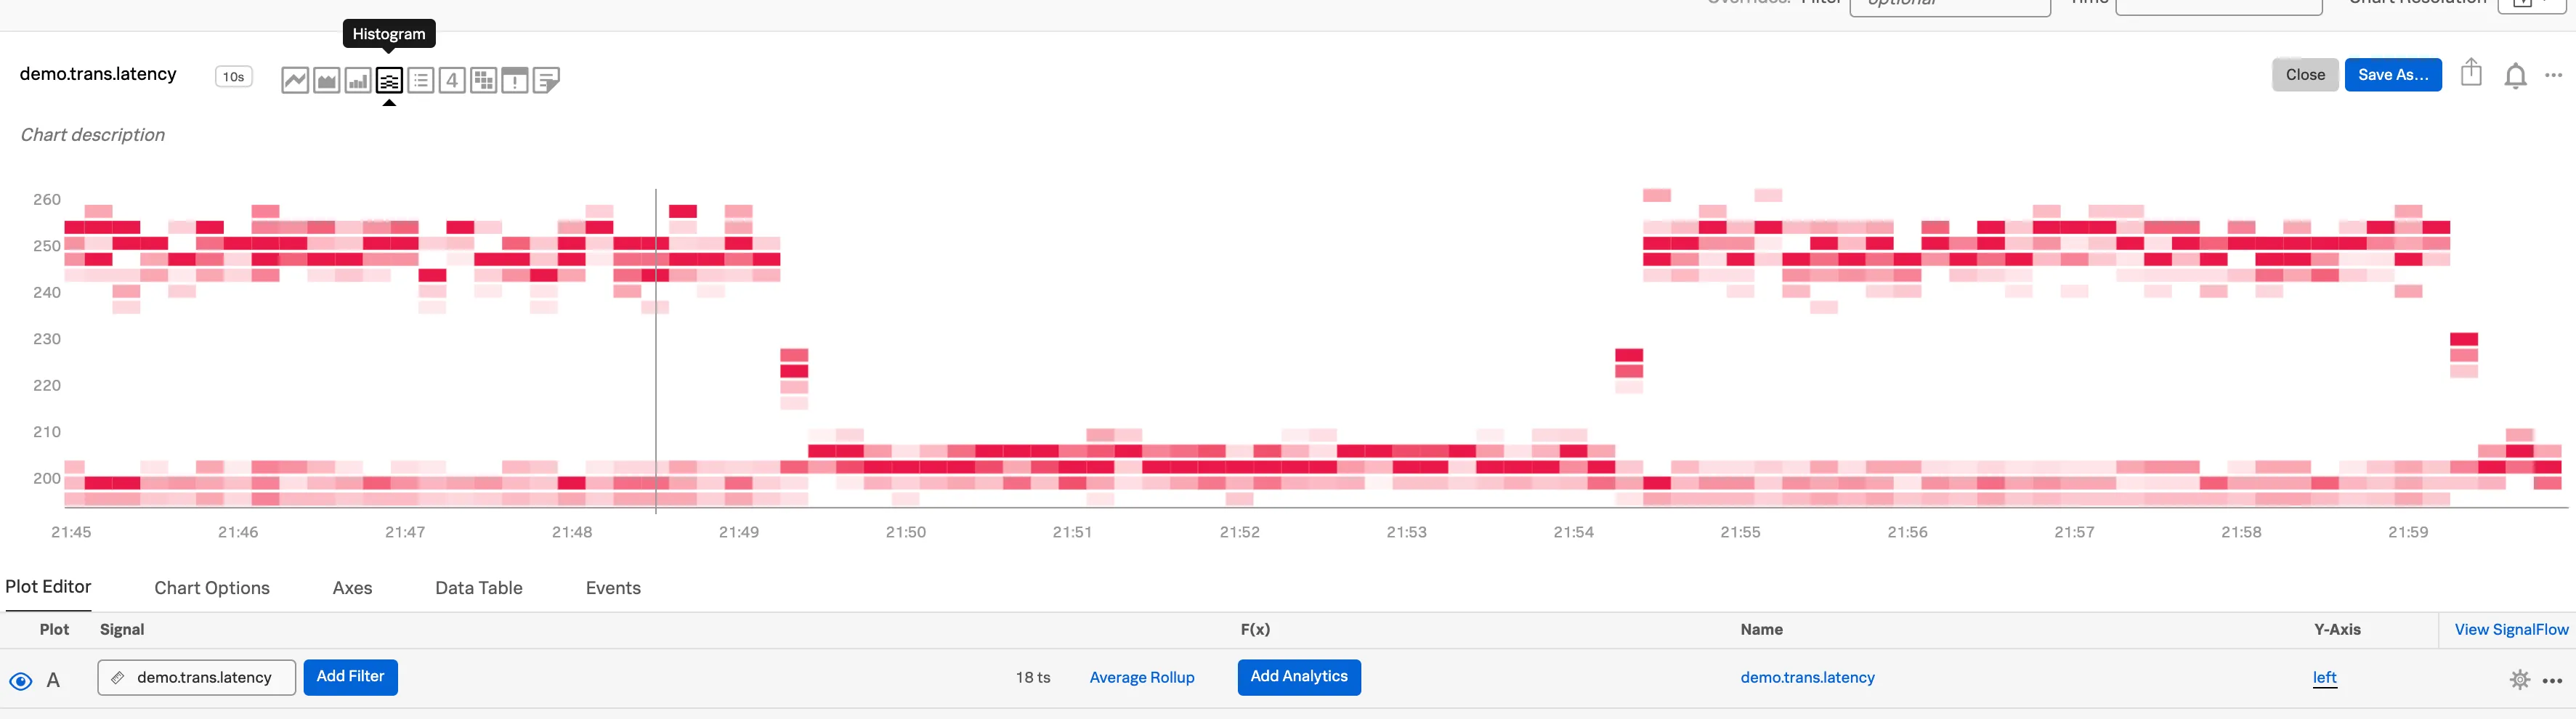
Metrics
This one might be a bit controversial, but I’ve found it helpful to tag spans with context about what the system was experiencing while processing the request. We fetch this information every ~10 seconds, cache it, and add it to every main span produced during that time.
Capturing metrics in this way is not mathematically sound. Since you only get data when traffic is flowing, you
can’t calculate a P90 for cpu load that would stand up to any rigorous scrutiny, but that’s actually fine
in practice. It’s close enough to get some quick signal while you’re debugging without switching to a different tool,
especially if you can avoid calculations and visualize with a heatmap.
I wouldn’t recommend setting alerts on this data though. Plain ol’ metrics are great for that.
Jessica Kerr recently wrote about this approach on the Honeycomb Blog.
| Attribute | Examples | Description |
|---|---|---|
metrics.memory_mb | 153 2593 | How much memory is being used by the system at the time its service this request |
metrics.cpu_load | 0.57 5.89 | CPU load of the system service this request. Given as # of active cores |
metrics.gc_count | 5390 | Last observed number of garbage collections. Could be cumulative (total since service started) or delta (ex: number in the last minute) |
metrics.gc_pause_time_ms | 14 325 | Time spent in garbage collections. Could also be cumulative or delta. Pick one and document which |
metrics.go_routines_count | 3 3000 | Number of go routines running |
metrics.event_loop_latency_ms | 0 340 | Cumulative time spent waiting on the next event loop tick. An important metric for Node apps |
Are these requests getting slow because we’re running out of memory or CPU?
SELECT
  HEATMAP(duration_ms),
  HEATMAP(metrics.memory_mb),
  HEATMAP(metrics.cpu_load)
WHERE
  main = true AND
  service.name = "api-service"
GROUP BY instance.id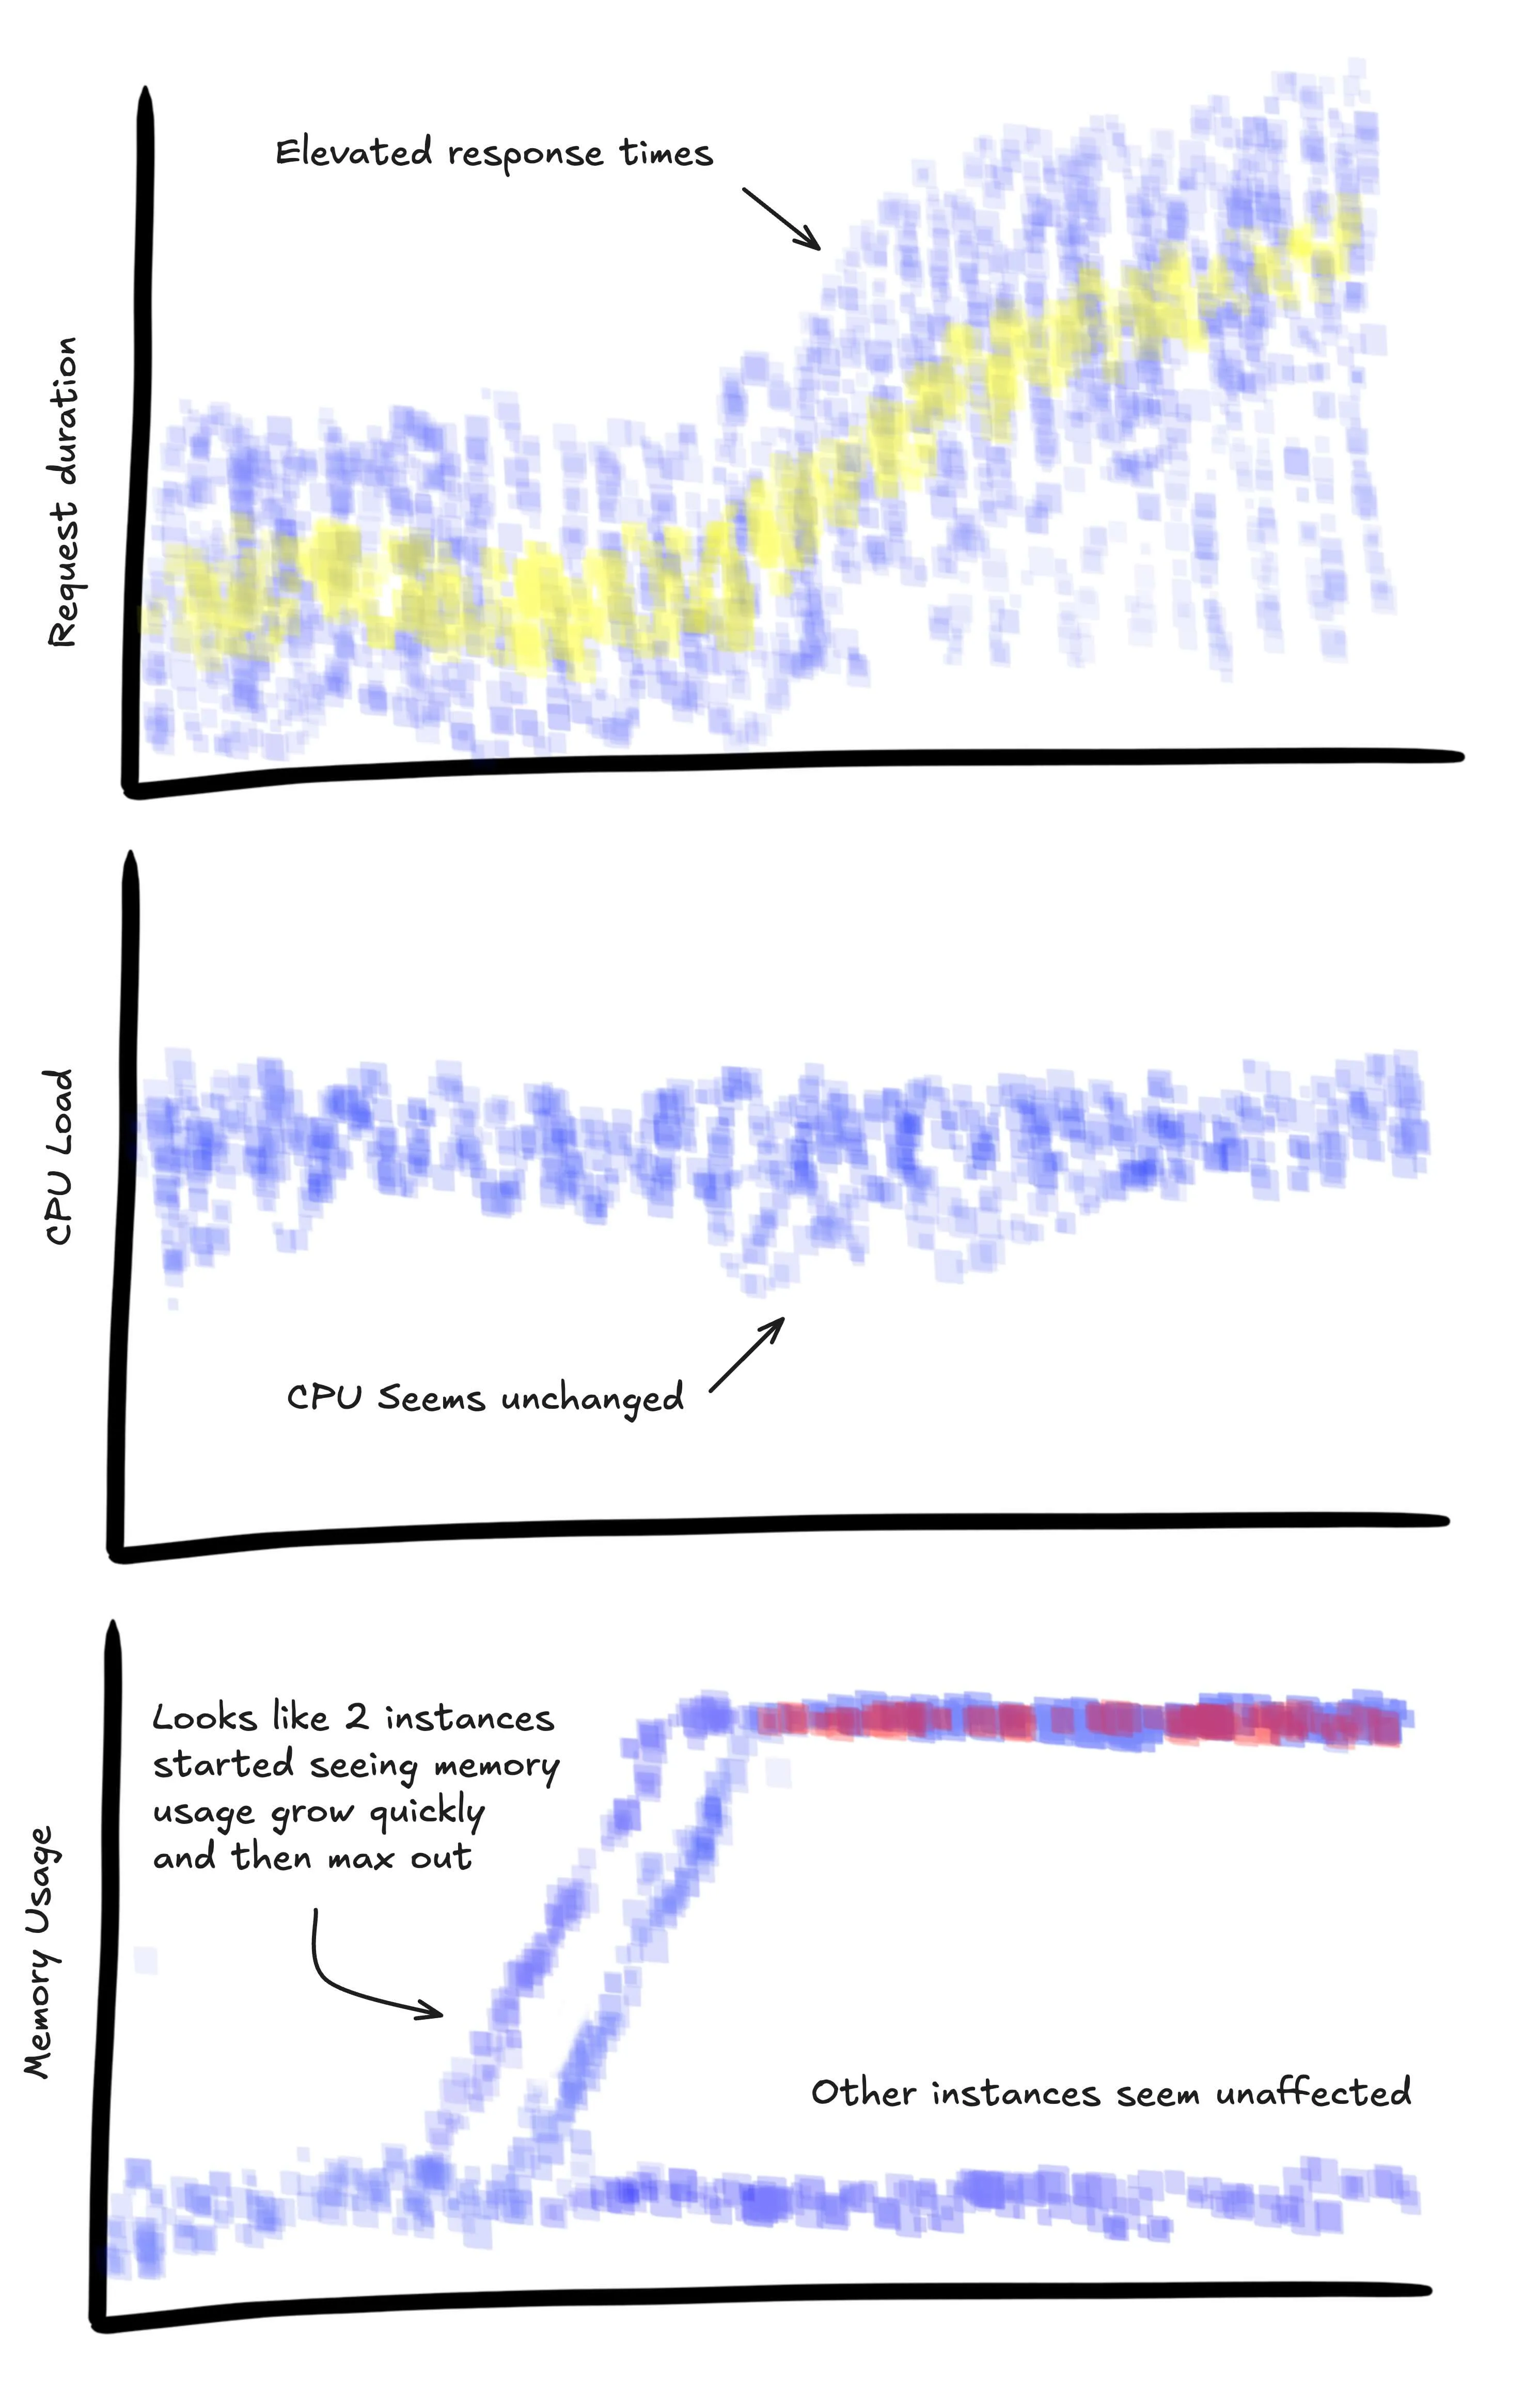
Async request summaries
When using a tracing system async requests should get their own spans, but it can still be useful to roll up some stats to identify outliers and quickly find interesting traces.
| Attribute | Examples | Description |
|---|---|---|
stats.http_requests_count | 1 140 | How many http requests were triggered during the processing of this request? |
stats.http_requests_duration_ms | 849 | Cumulative time spent in these http requests |
stats.postgres_query_count | 7 742 | How many Postgres queries were triggered during the processing of this request? |
stats.postgres_query_duration_ms | 1254 | Cumulative time spent in these Postgres queries |
stats.redis_query_count | 3 240 | How many redis queries were triggered during the processing of this request? |
stats.redis_query_duration_ms | 43 | Cumulative time spent in these redis queries |
stats.twilio_calls_count | 1 4 | How many calls to this vendors api were triggered during the processing of this request? |
stats.twilio_calls_duration_ms | 2153 | Cumulative time spent in these vendor calls |
Surely my service makes a reasonable number of calls to the database… right?
SELECT
  HEATMAP(stats.postgres_query_count)
WHERE
  main = true AND
  service.name = "api-service"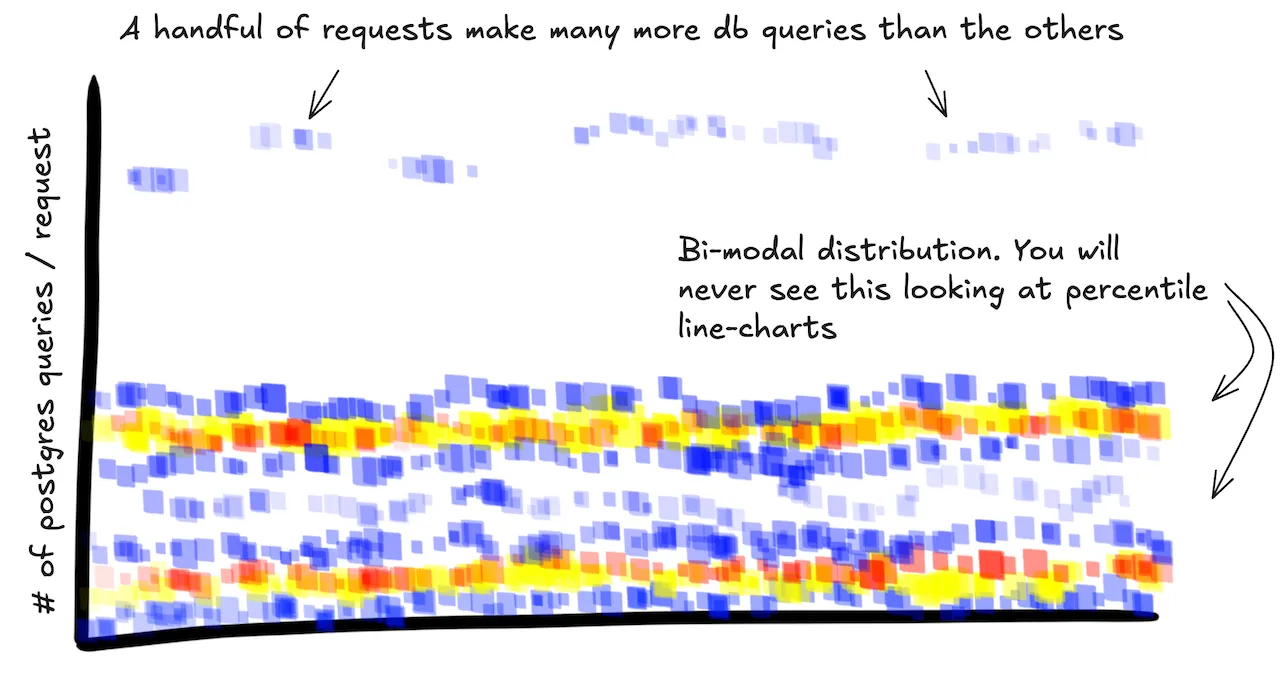
Instead of adding this explicitly, couldn’t we aggregate this by querying the whole trace? See Frequent Objections
Sampling
Once you start collecting fine-grained telemetry from your systems at a significant scale you run head-on into the problem of sampling. Running systems can produce a lot of data! Engineers frequently want to store and query all of it. Exact answers always! Make it fast! Also cheap! But it’s trade-offs all the way down. Telemetry data is fundamentally different from the transaction data you’re storing for your users, and you should think about it differently.
Luckily you only really need a statistically significant subset of the full dataset. Even sampling 1 out of every 1000 requests can provide a suprisingly detailed picture of the overall traffic patterns in a system.
Sampling is a suprisingly deep topic. Keep it simple if you’re starting and do uniform random head sampling, but track your sample rate per-span so you can be ready for more sophisticated approaches down-the-line.
Good tooling will weight your calculations with a per-span, so you don’t have to mentally multiple the COUNT
call by the sample_rate to get an accurate answer. Here are some relevant articles:
- I was first introduced to this idea in the Scuba paper
- Honeycomb supports per-event sample rates
- Cloudflare’s Analytics Engine will automatically sample for you based on volume
| Attribute | Examples | Description |
|---|---|---|
sample_rate | 1 500 | N where 1 in N events will be sampled and stored and the rest dropped. If you’re sampling 1% of requests, the sample_rate would be 100 |
Timings
I find it super useful to break up the work that gets done to respond to a request into a handful of important chunks and track how long each segment took on the main span.
Wait, isn’t that what child spans are for?
Wrapping absolutely everything in its own span is the most common failure mode I see when engineers first get access to tracing tools. You have to design the structure of your data for the way you want to query it.
Child spans are helpful for waterfall visualization for a single request, but can be difficult to query and visualize across all of your requests. Putting that information on a single span makes it easier to query and also helps with tools like Honeycomb’s BubbleUp which can then immediately tell you that that group of requests was slow because authentication took 10 seconds for some reason.
| Attribute | Examples | Description |
|---|---|---|
auth.duration_ms | 52.2 0.2 | How long did we spend performing authentication during this request? |
payload_parse.duration_ms | 22.1 0.1 | Identify the core workloads of the service and add timings for them |
Errors
If you encounter an error and need to fail the operation, tag the span with the error information: type, stacktrace, etc.
One approach that I have found super-valuable is tagging each location where we throw an error with a unique slug describing
the error. If this string is unique within your codebase, it is easily found with a quick search. This allows someone
to jump straight from a spike in errors on a dashboard to the exact line of code that throwing the error. It also provides
a convenient low-cardinality field to GROUP BY.
You’re unlikely to be able to wrap all possible errors, but any time a failed request doesn’t have an exception.slug
that is a good sign that you have places in your code where your error handling could be improved. It’s now really easy
to find examples of requests that failed in ways you didn’t anticipate.
if isNotRecoverable(err) {
  // note the use of a plain string, not a variable, not dynamically generated
  // consider enforcing this with custom lint rules
  setErrorAttributes(err, "err-stripe-call-failed-exhausted-retries");
  throw err;
}| Attribute | Examples | Description |
|---|---|---|
error | true false | Special field for whether the request failed or not |
exception.message | Can't convert 'int' object to str undefined is not a function | The exception message encoded in the exception |
exception.type | IOError java.net.ConnectException | The programmatic type of the exception |
exception.stacktrace | ReferenceError: user is not definedat myFunction (/path/to/file.js:12:2)... | Capture the stack trace if its available to help pin-point where the error is being thrown |
exception.expected | true, false | Is this an expected exception like a bot trying to hit a url that doesn’t exist? Allows filtering out of exceptions we can’t prevent but don’t need to worry about |
exception.slug | auth-error invalid-route github-api-unavailable | Create a unique grepp-able slug-value to identify the code location of an error if its predictable during development time |
Which of our enterprise users hit the most errors last week? And which one?
SELECT
  COUNT_DISTINCT(user.id)
WHERE
  main = true AND
  service.name = "api-service" AND
  user.type = "enterprise"
GROUP BY exception.slug
Show me traces where we likely need to improve our error handling
SELECT
  trace.trace_id
WHERE
  main = true AND
  service.name = "api-service" AND
  error = true AND
  exception.slug = NULL
GROUP BY trace.trace_id
Feature flags
Fine-grained feature flags are a developer super power that allows you to test code changes in production with only a fraction of your users or traffic. Adding the flag information per-request allows you to compare how the new code is working as you opt more of your traffic into the new code path. Coupled with the broad visibility you can get with wide events, and this can make even tricky migrations vastly more manageable and allow you to ship code with confidence.
Note that semantic conventions differ here and suggest adding feature flag information as events on the span. I would suggest following that standard since it will ultimately have the best support from vendors if it’s moved to stable, but especially in the mean time, I’m also putting this info on the main span.
| Attribute | Examples | Description |
|---|---|---|
feature_flag.auth_v2 | true false | The value of a particular feature flag for this request |
feature_flag.double_write_to_new_db | true false | The value of a particular feature flag for this request |
What errors are the users in the new authentication flows hitting? How does it compare to the control group?
SELECT
  COUNT
WHERE
  main = true AND
  service.name = "api-service" AND
GROUP BY feature_flag.auth_v2, exception.slug
Versions of important things
Runtimes, frameworks, and any major libraries you are using can be really helpful context.
| Attribute | Examples | Description |
|---|---|---|
go.version | go1.23.2 | What version of your language runtime are you using? |
rails.version | 7.2.1.1 | Pick out any core libraries like web frameworks and track their version too |
postgres.version | 16.4 | If you can add the versions of any datastores you’re using, even better |
A security issue with Rails just got announced. What versions of the framework are our services using?
SELECT
  COUNT_DISTINCT(service.name)
WHERE
  service.environment = "production"
GROUP BY rails.version
Our memory usage seems higher that it used to be. Didn’t we upgrade the runtime recently? Does that correlate?
SELECT
  HEATMAP(metrics.memory_mb)
WHERE
  main = true AND
  service.name = "api-service"
GROUP BY go.version
Your specific application
Now we go off the map and get to the really valuable stuff. Your app likely does something unique or works in a particular domain. You might need to really care about which professional credentials a Dentist using your app has, or which particular storage warehouse a package is in, or which chip is in the embedded tracking device installed in the cat that your app exists to track.
No framework is going to be able to understand what parts of your domain are important to track and automate this for you, you have to do that.
| Attribute | Examples | Description |
|---|---|---|
asset_upload.s3_bucket_path | s3://bucket-name/path/to/asset.jpg | If you upload something, add context about where |
email_vendor.transaction_id | 62449c60-b51e-4d5c-8464-49217d91c441 | If you interact with a vendor, track whatever transaction ID they give you in case you need to follow up with them |
vcs_integration.vendor | github gitlab bitbucket | If there are 3-4 types that something might fall into, be sure to add that context. Ex: If 2% of requests start failing because bitbucket is experiencing issues, this will help identify the source of the issue immediately. |
process_submission.queue_length | 153 1 | Any time you interact with a queue, see if you can get the current length during submission |
Things to note
You should probably add the thing
If you find yourself asking “Am I ever really going to need this bit of data?”, default to throwing the attribute on. The marginal cost of each extra attribute is very small. If the data volume does start to grow, prefer wider, more context-rich events and a higher sample rate vs smaller events with a lower sample rate.
Heatmaps are your friend
Honeycomb’s heatmaps are amazing at helping you find outliers, seeing multi-modal distributions, and getting a feel for your data. I wish more tooling supported them. I am not sure I can build software without them any more.
Embrace the feedback loop
When you are modifying code, make a change to the telemetry so that you can see the impact of the new code running. Once the code is released, check to make sure that you see the outcome you expected. Don’t hesitate to add specific fields for one release and them remove them after.
Tighter feedback loops are like going faster on a bicycle. They make for more stable systems and let you move faster with confidence.
Semantic conventions and naming consistency
I’ve tried to embrace semantic conventions in my naming, but would not be surprised if I’ve made multiple errors. Naming is hard!
It’s also hard to get consistency right within an organization or even across multiple systems owned by the same team. I would recommend trying to use semantic conventions as a guide, but do prioritize getting data out of your system in some form and getting some early wins over exacting adherence to an evolving specification. Once this data has proven its value within your organization, then you will have the leverage to spend engineering cycles on making things consistent.
In the long run semantic conventions should allow Observability vendors to build new value and understanding on top of the telemetry you emit, but this effort is only just getting started.
Frequent Objections
Does this really work??
I have done this for dozens of production systems. Every single time the data has been invaluable for digging in and understanding what the system is actually doing, and we’ve found something surprising, even for the engineers who had worked on the system for many years.
Things like:
- Oh, actually 90% of the traffic of this system comes from one user
- Wait, one of our worker processes is actually running a month old version of the code somehow?
- This API endpoint usually has payloads of 1-2kb, but there is an edge case affecting one user where it’s 40+MB. This causes their page loads to be several minutes longer than the p99.
- After instrumenting the authentication middleware, around 20% of requests still didn’t have user info. There was a whole second authentication system for a different class of users that hadn’t been touched in years.
- This endpoint that we’d like to deprecate accepts data in the form of
A,B, andC, but none of our traffic ever even usesC. We can just drop support for that now.
I don’t like it. This feels wrong
For anyone feeling that way now, I ask you to give it five minutes.
I find that when a log line wraps around your terminal window multiple times, most developers have a pretty visceral negative reaction.
This feels right:
[2024-09-18 22:48:32.990] Request started http_path=/v1/charges request_id=req_123
[2024-09-18 22:48:32.991] User authenticated auth_type=api_key key_id=mk_123 user_id=usr_123
[2024-09-18 22:48:32.992] Rate limiting ran rate_allowed=true rate_quota=100 rate_remaining=99
[2024-09-18 22:48:32.998] Charge created charge_id=ch_123 permissions_used=account_write request_id=req_123
[2024-09-18 22:48:32.999] Request finished http_status=200 request_id=req_123
But this feels wrong:
[2024-10-20T14:43:36.851Z] duration_ms=1266.1819686777117 main=true http.ip_address=92.21.101.252 instance.id=api-1 instance.memory_mb=12336
instance.cpu_count=4 instance.type=t3.small http.request.method=GET http.request.path=/api/categories/substantia-trado
http.route=/api/categories/:slug http.request.body.size=293364 http.request.header.content_type=application/xml
user_agent.original="Mozilla/5.0 (X11; Linux i686 AppleWebKit/535.1.2 (KHTML, like Gecko) Chrome/39.0.826.0 Safari/535.1.2" user_agent.device=phone
user_agent.os=Windows user_agent.browser=Edge user_agent.browser_version=3.0 url.scheme=https url.host=api-service.com service.name=api-service
service.version=1.0.0 build.id=1234567890 go.version=go1.23.2 rails.version=7.2.1.1 service.environment=production service.team=api-team
service.slack_channel=#api-alerts service.build.deployment.at=2024-10-14T19:47:38Z
service.build.diff_url=https://github.com/your-company/api-service/compare/c9d9380..05e5736
service.build.pull_request_url=https://github.com/your-company/api-service/pull/123
service.build.git_hash=05e5736 service.build.deployment.user=keanu.reeves@your-company.com
service.build.deployment.trigger=manual container.id=1234567890 container.name=api-service-1234567890 cloud.availability_zone=us-east-1
cloud.region=us-east-1 k8s.pod.name=api-service-1234567890 k8s.cluster.name=api-service-cluster feature_flag.auth_v2=true
http.response.status_code=401 user.id=Samanta27@gmail.com user.type=vip user.auth_method=sso-google user.team_id=team-1
You are structuring data so that it can be read efficiently by machines, not humans. Our systems emit too much data to waste precious human lifetimes using our eyeballs to scan lines of text looking for patterns to jump out. Let the robots help.
This seems like a lot of work
If you want to implement everything I’ve talked about in this post that would be a ton of work. However, even implementing the easiest subset is going to provide a lot of value. Not doing this results in so much more work building a mental model of your system, trying to debug by thinking through the code and hoping your mental model matches reality.
A lot of this logic can be put into shared libraries within your org, though getting them adopted, keeping them updated and in-sync, and getting engineers used to these tools presents a whole different set of challenges.
Many of these things could be surfaced to you by opinionated platforms or frameworks. I would love to see things move in this direction.
Isn’t this a lot of data? Won’t it cost a lot??

First, you should compare this to your current log volume per request. I have seen many systems where this approach would reduce overall log volume.
However storing this data for every request against your system could be too expensive at scale. That’s where sampling comes in. Sampling gives you the controls to determine what you want to spend vs the value you receive from storing and making that data available to query.
Realtime OLAP systems are also getting cheaper all the time. Once upon a time Scuba held all data in memory to make these types of questions quick to answer. Now most OLAP systems are evolving to columnar files stored on cloud object storage with queries handled by ephemeral compute which is many orders of magnitude cheaper.
In the next section I’ll show just how much cheaper.
Repeated data
Many of these fields will be the same for every request. Isn’t that really inefficient?
This is where our intuitions can lie to us. Let’s look at a concrete example.
I wrote a script
[1]
to generate a newline-delimited JSON file with a lot of the above fields and at least somewhat reasonable fake values.
Let’s say our service is serving 1000 req/s all day and sampling 1% of that traffic. Rounding to a whole number, that’s about a
million events. Generating a million example wide events results in a 1.6GB file.
http_logs.ndjson 1607.61 MBBut we repeat the keys on every single line. Even just turning it into a CSV cuts the size by more than 50%.
http_logs.csv 674.72 MBGzipping the file shows an amazing amount of compression, hinting that this isn’t as much data as we might think.
http_logs.ndjson.gz 101.67 MBColumn store formats like parquet and Duckdb’s native format can do even better.
http_logs.parquet 88.83 MB
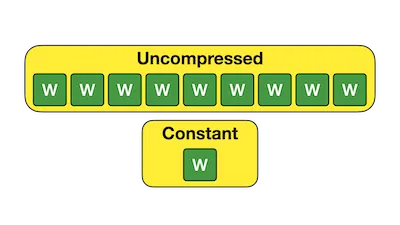
http_logs.duckdb 80.01 MBThey store all of the data for a specific column contiguously, which lends itself to different compression approachs. In the simplest case, if the column is always the same value, it can store that fact only once. Values that are the same across an entire row group are incredibly cheap.
If there are 2-3 different values, it can use dictionary-encoding to bit-pack these values really tightly. This also speeds up queries against this column.
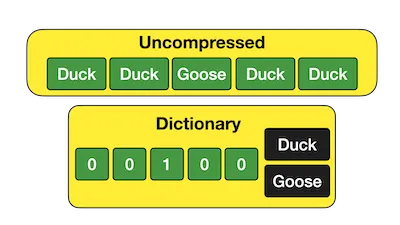
DuckDB has a great writeup on this which goes into much more detail. All of the data remains available and is easily (and quickly!) queryable.
This is hardly “big data”. Storing this on Cloudflare’s R2 for a month would cost US$ 0.0012.
You could keep 60 days of retention for US$ 0.072 / month.
❯ duckdb http_logs.duckdb
D SELECT COUNT(*) FROM http_logs;
┌──────────────┐
│ count_star() │
│    int64     │
├──────────────┤
│      1000000 │
└──────────────┘
Run Time (s): real 0.002 user 0.002350 sys 0.000946
D SELECT SUM(duration_ms) FROM http_logs;
┌───────────────────┐
│ sum(duration_ms)  │
│      double       │
├───────────────────┤
│ 999938387.7714149 │
└───────────────────┘
Run Time (s): real 0.003 user 0.008020 sys 0.000415
There are even in-memory and transport formats to help reduce size in memory and on the wire. OpenTelemetry is adopting arrow for its payloads for this reason.
I found this podcast on the FDAP stack particularly helpful in understanding this space.
Couldn’t we JOIN data from multiple spans together to get this information? Query the whole trace at once?
This is certainly possible. Honeycomb has started allowing you to filter on fields on other spans in the same trace. However I’d qualify this as very advanced. You want to make the right thing the easiest thing, and if you make it harder to ask questions, people will simply ask fewer questions. There are already a million things competing for our attention. Keep it simple. Make it fast.
Does this mean I don’t need metrics?
You should probably still generate high-level metrics, though I bet you will need far fewer.
Metrics are great when you know you want an exact answer to a very specific question that you know ahead of time. Questions like “How many requests did a serve yesterday?” or “What was my CPU usage like last month?”